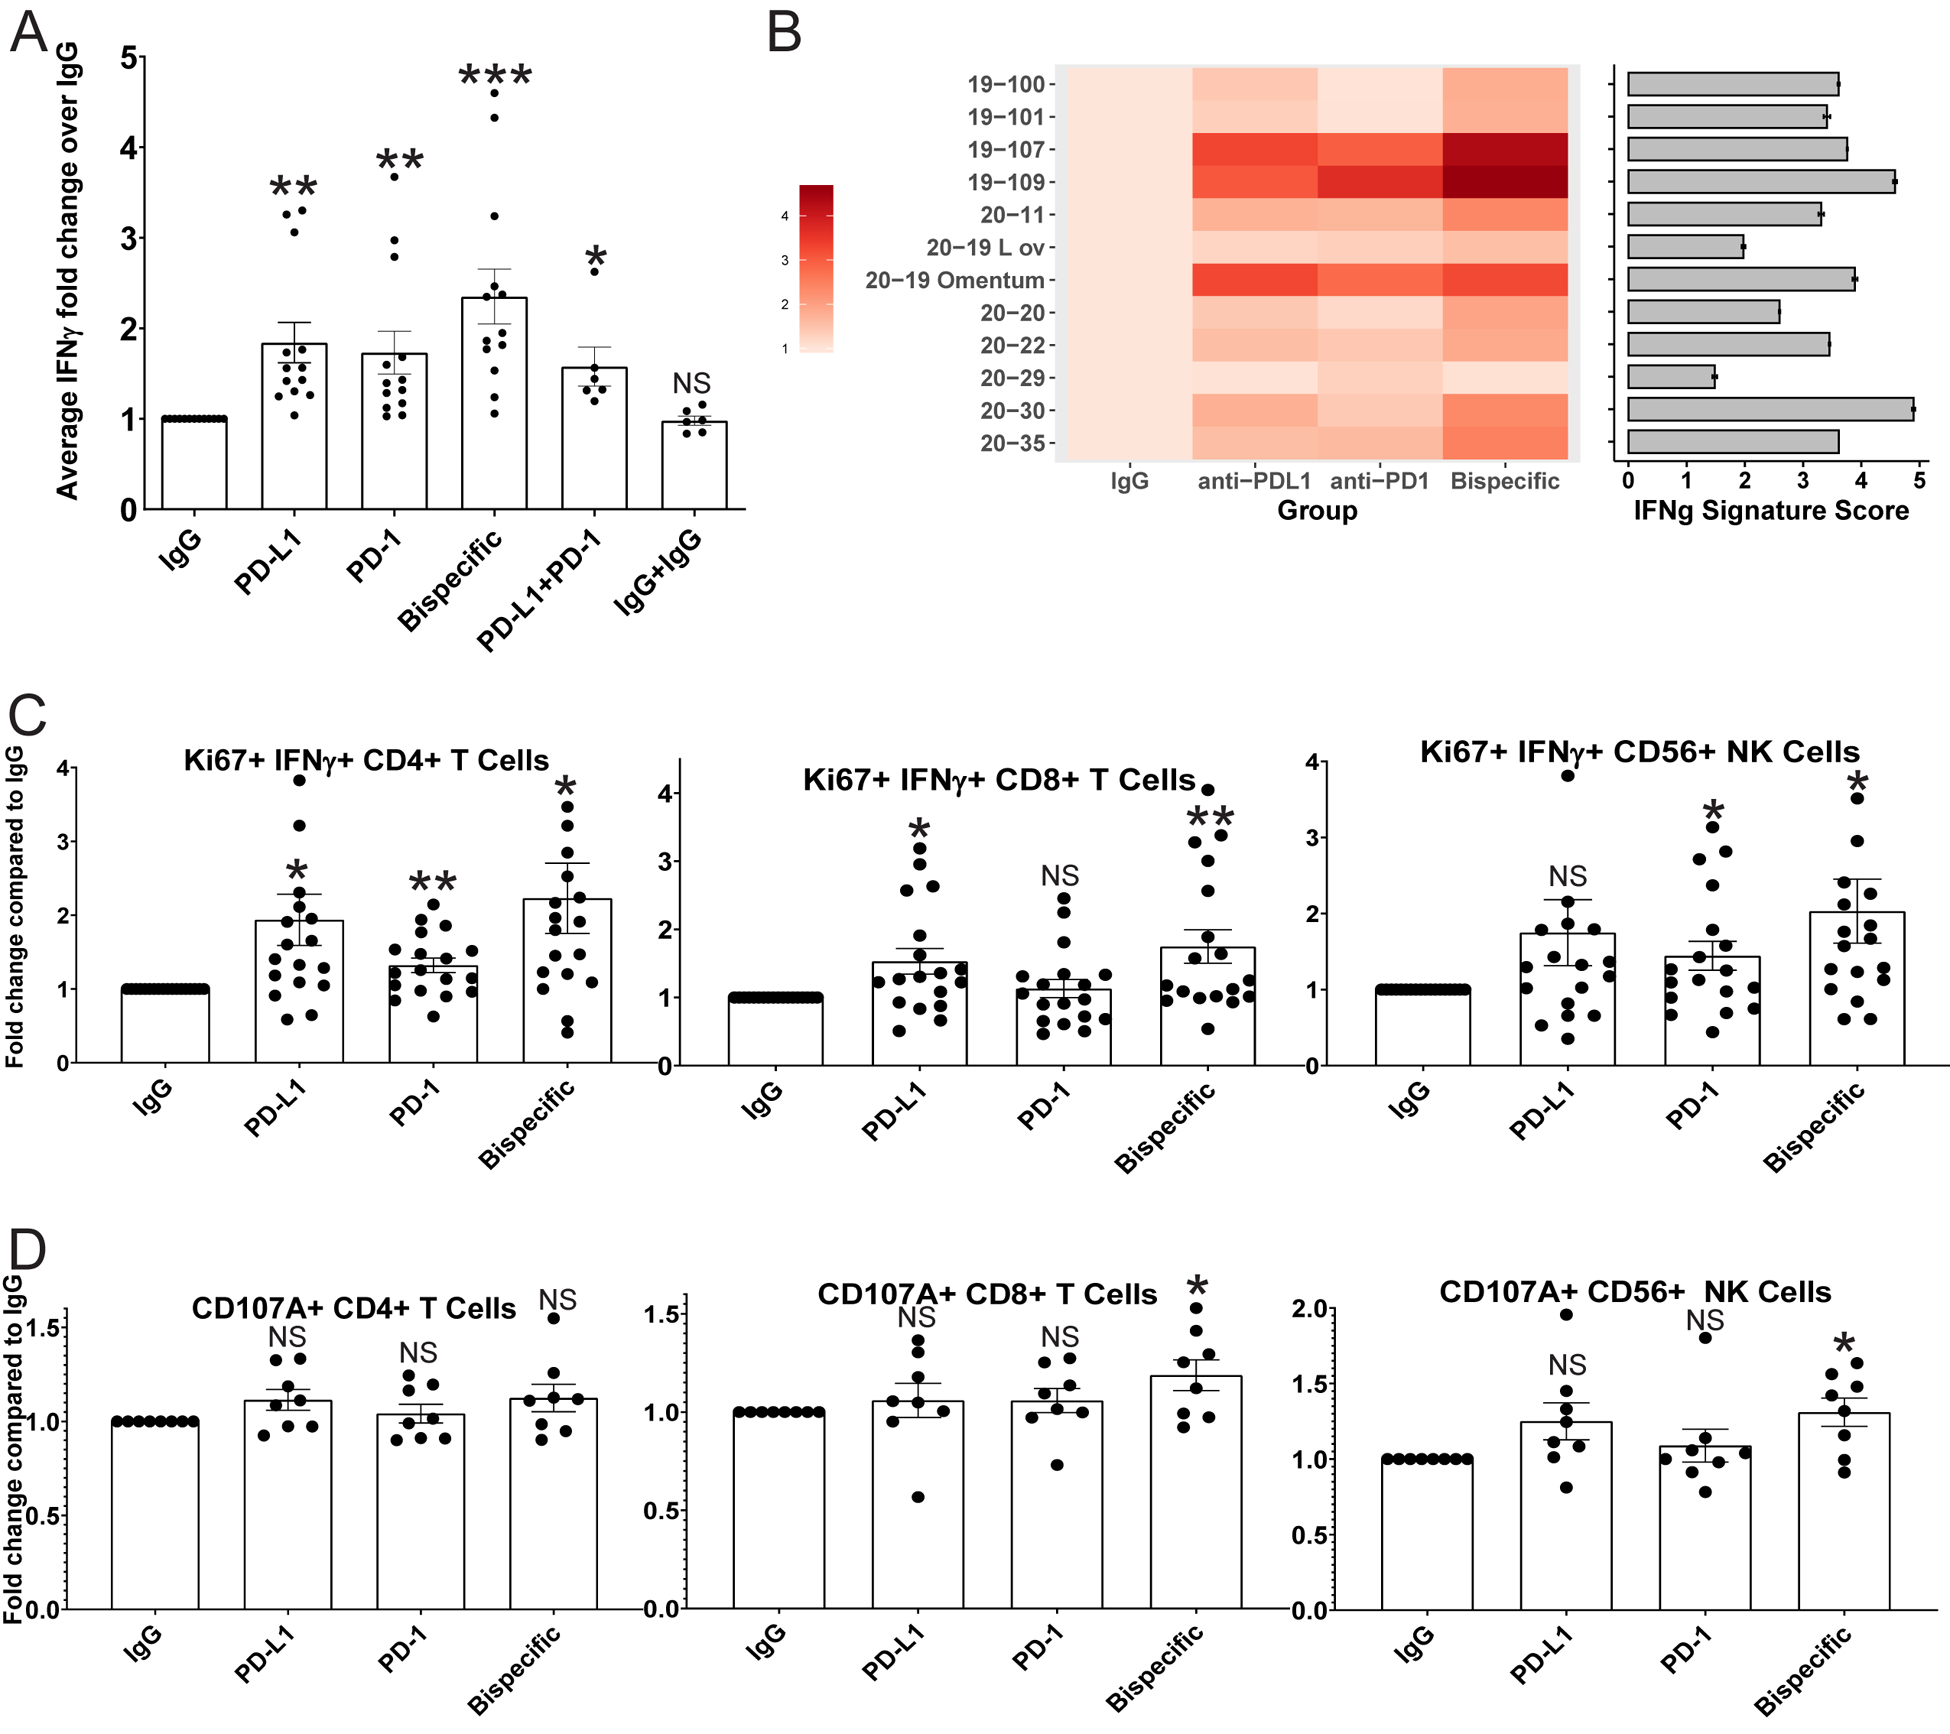
FIGURE 2: ICB antibodies induce detectable IFNγ production in proportion to the parent tumor aggregate immune state, increased CD4, CD8, and NK cell activity, and a killing phenotype in CD8 T and NK cells in HGSC co-cultures:

A) IFNγ ELISA analysis was performed on media from organoid co-cultures treated with IgG control, anti-PD-L1, anti-PD-1, anti-PD-1/PD-L1 (bispecific), anti-PD-1+anti-PD-L1, and IgG+IgG. Average IFNγ amounts normalized to the IgG control are shown here across all experiments with error bars representing standard error of the mean. p-values were calculated for all comparisons using a paired t-test. Comparisons of key antibodies to the IgG control are shown. *<0.05, **<0.005, ***<0.0005. p-values for the significance of other treatment comparisons are shown in Figure S6. B) A heatmap is shown for the normalized ELISA results of each individual tumor for IgG, anti-PD-L1, anti-PD-1, and the bispecific antibody. The color code is shown on the left. In addition, bulk RNA sequencing was performed on the parent tumors used to generate the co-cultures, and an IFNG signature score was generated. Each tumor was sequenced twice, and the average IFNG score from each parent tumor is shown to the right of the heatmap as a horizontal bar graph with the number score key below. Error bars represent standard deviation. C) Flow cytometry analysis for IFNγ/Ki67 double positive CD4, CD8, and CD56 positive NK cells across treatments normalized to the IgG control. D) Flow cytometry analysis for CD107A expression on CD4, CD8, and CD56 positive NK cells across treatments normalized to the IgG control. *p<0.05, **p<0.005, NS=Not significant. Error bars represent standard error of the mean.
