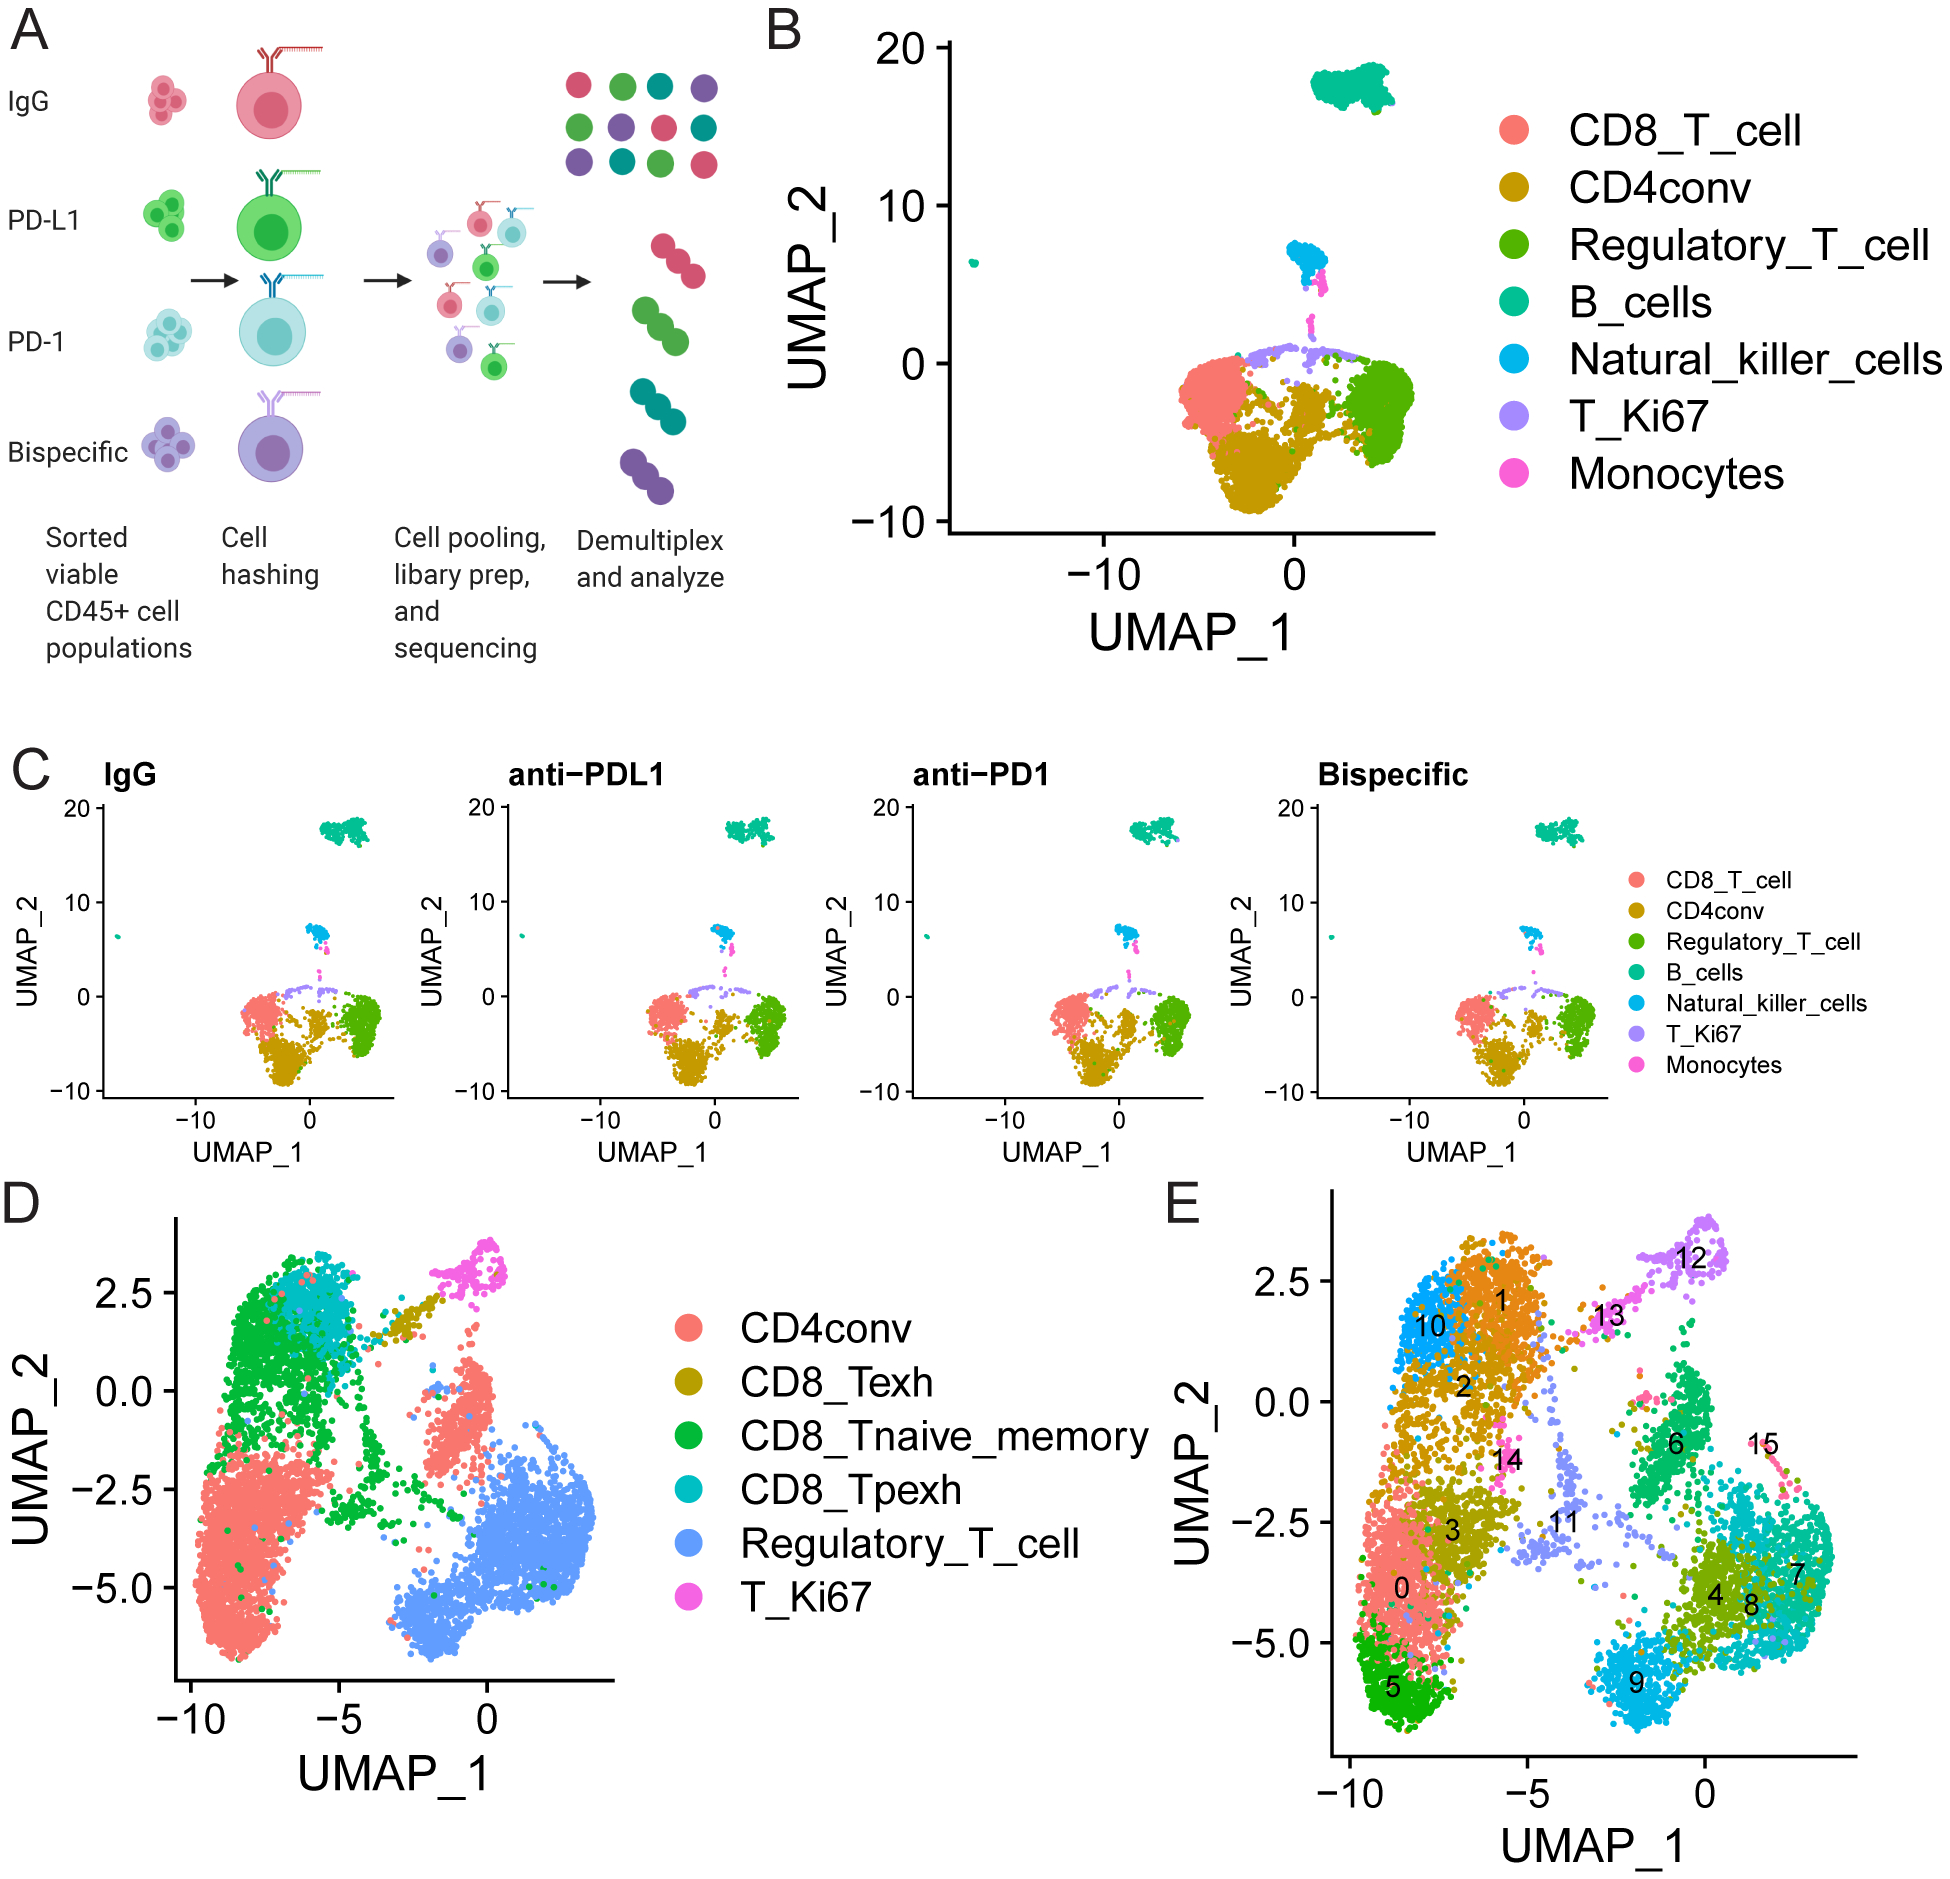
FIGURE 3: scRNA-seq analysis of treated organoid co-cultures offers a comprehensive assessment of all immune cell types post-ICB treatment:

A) Schematic of scRNA-seq experiment. A single organoid co-culture was treated with isotype control, anti-PD-L1, anti-PD-1, or anti-PD-1/PD-L1. Viable CD45+ cells were sorted 96 hours later, hashed with different barcodes for each treatment, mixed in equal proportion, and submitted for 10X Genomics library preparation and subsequent sequencing analysis. B-E) scRNA-seq analysis comparing results in the organoid co-cultures across treatments. B) UMAP demonstrating all immune cells detected in the pool of mixed cells from all treatments from the organoid co-cultures. The color code for each cell type is shown on the right. C) UMAPs demonstrating the cells detected in organoid co-cultures from each treatment in the populations in B shown separately to demonstrate equal distribution of all lineages across treatment. Treatment is indicated above the graph and cell type is indicated by a color code on the right. D and E) UMAPs are shown to demonstrate (D) all T cell subsets detected across the mixture of cells analyzed across all four treatments and (E) that within each of these subsets there are 15 separate clusters with unique transcriptional states. Cell types are indicated by color codes on the right, and clusters are numbered in E. CD4conv=conventional non-regulatory CD4 T cells, Regulatory_T_cell=regulatory CD4 T cells, T_Ki67=proliferating T cells, CD8_Tpexh=Progenitor exhausted CD8 T cells, CD8_Tnaive_memory=Naïve and memory CD8 T cells, Regulatory_T_cell=Regulatory CD4 T cells, CD8_Texh=Terminally exhausted CD8 T cells
