
FIGURE 4: scRNA-seq analysis reveals that the bispecific antibody induces an increased cytotoxic phenotype in CD8 T cells and NK cells and a decreased exhaustion and naivety phenotype in CD8 T cells:
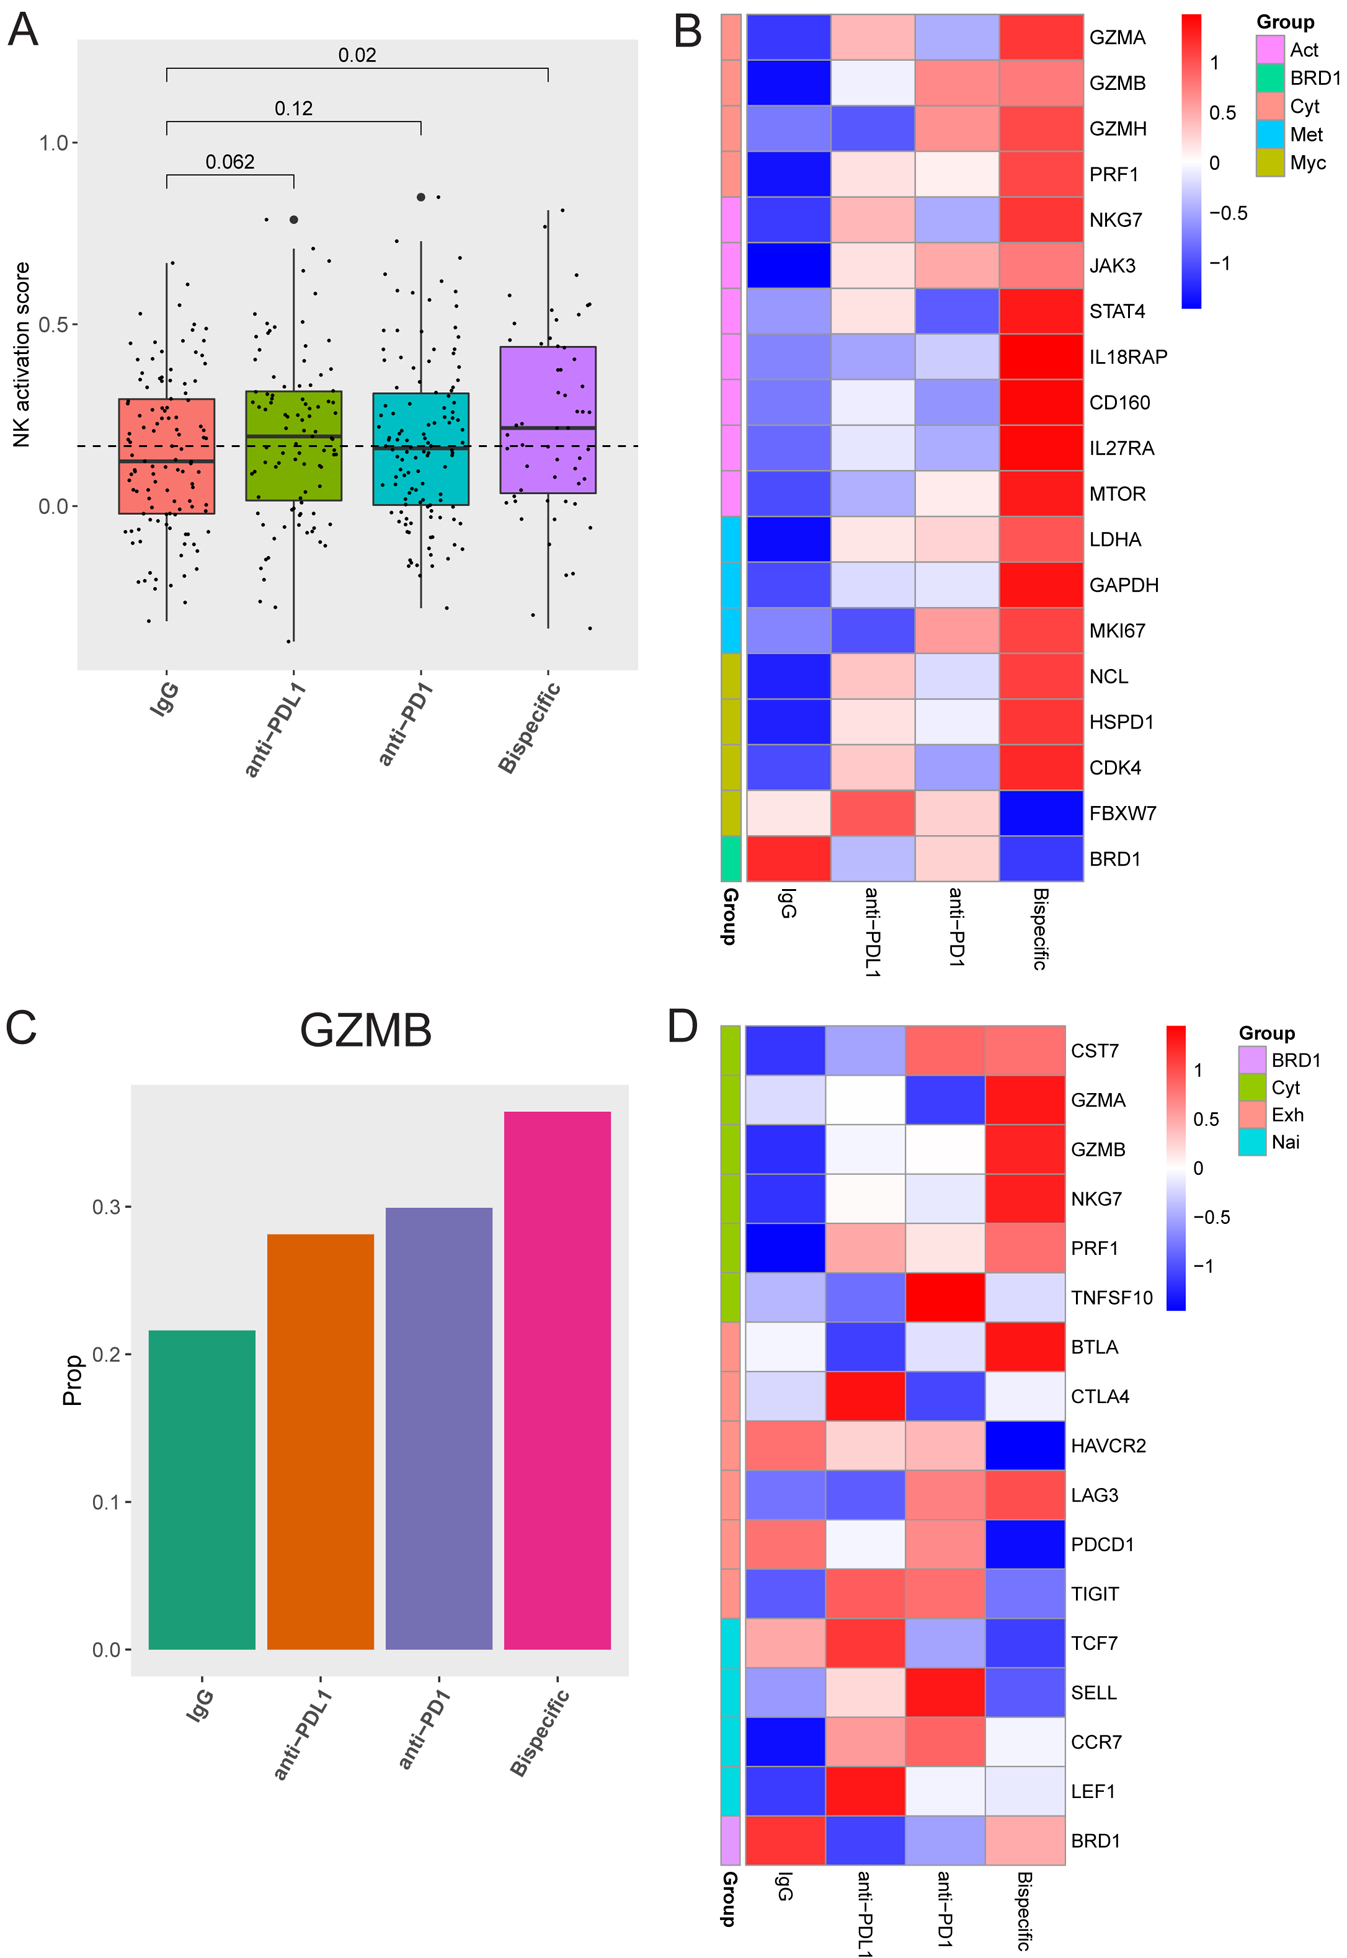
A) Activation scores were generated by assessing a panel of 22 genes associated with NK cell activation. Box plots of the average scores for each treatment are shown with p-values on top generated using a one-tailed t-test compared to the isotype control. B) A heatmap demonstrating Z scores generated from mean expression in NK cells for genes related to cytotoxicity (cyt, top), activation, (act, second from top), metabolism (met, second from bottom), Myc signaling (Myc, third from bottom), and BRD1 (bottom) is shown comparing IgG, anti-PD-L1, anti-PD-1, and the bispecific antibody. C) The positive rate of Granzyme B (GZMB) expression across all treatments in all CD8 T cell populations combined is shown. D) A heatmap demonstrating Z scores generated from mean expression in all CD8 T cell populations combined for genes related to cytotoxicity (cyt, top), exhaustion (exh, second from top), naivety (nai, second from bottom), and BRD1 (bottom) is shown comparing IgG, anti-PD-L1, anti-PD-1 and the bispecific antibody.