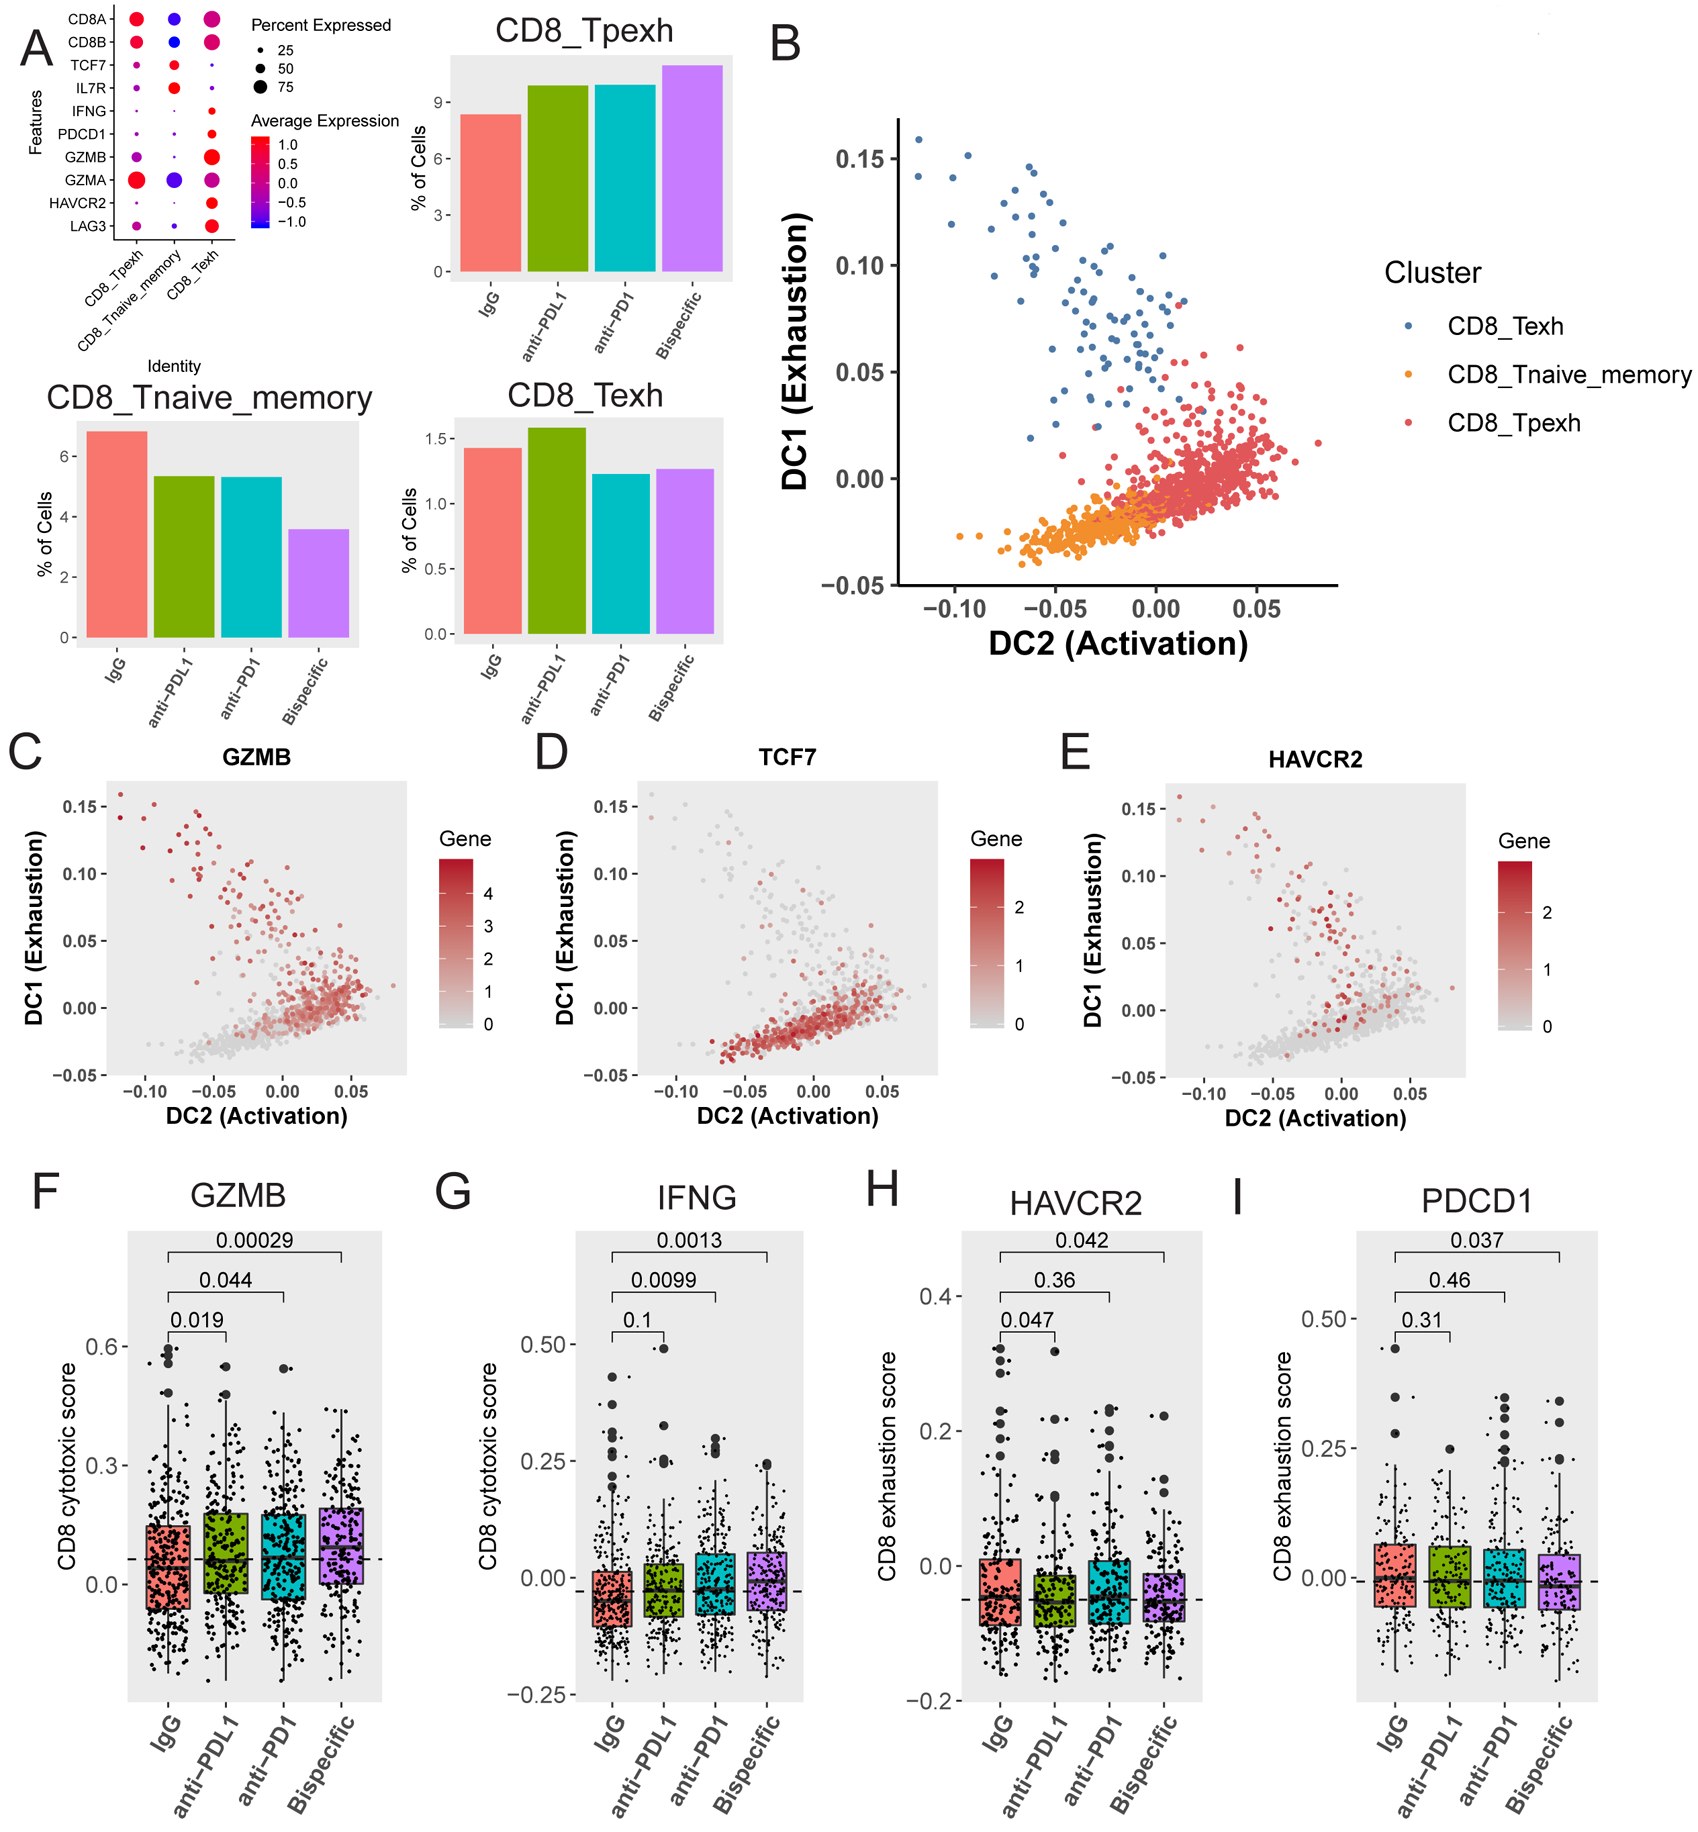
FIGURE 5: scRNA-seq analysis reveals state changes in CD8 T cells between distinct subsets:

A) Definition of and percentage of CD8 T cells in naïve (CD8_Tnaive_memory), progenitor exhausted (CD8_Tpexh), and terminally exhausted (CD8_Texh) CD8 T cell groups (mapped in Figure 3D–E). On the top left is a bubble map demonstrating markers used to define these three groups. Markers (Y axis) used to define each of the different groups (X axis) are shown here along with the expression level in each defined cell type. The average expression level (colors) is shown in the percentage of cells (sphere) expressing each marker for each cell type. Bar graphs demonstrating the proportion of CD8 T cells in progenitor exhausted (top right), naïve (bottom left), and terminally exhausted (bottom right) CD8 T cell groups across antibody treatments are shown. B) Diffusion map demonstrating transition between 1) naïve (orange) and progenitor exhausted (red) cells, and 2) terminally exhausted (blue) and progenitor exhausted (red) cells over pseudotime. The X axis represents increasing activation, and the Y axis represents increasing exhaustion. The color code for the different clusters/subgroups is shown on the top right. C, D, E) Diffusion maps demonstrating transition between naïve and progenitor exhausted cells and terminally exhausted and progenitor exhausted cells (mapped in B) over pseudotime for C) the activation marker GZMB (Granzyme B), D) the naivety marker TCF7, and E) the exhaustion marker HAVCR2 (TIM3). The X axis represents increasing activation, and the Y axis represents increasing exhaustion. The color code for gene expression level is shown on the right. F and G) Activation scores were generated by assessing a panel of 50 genes associated with (F) GZMB (Granzyme B) or (G) IFNG expression in CD8 T cells in naïve and progenitor exhausted CD8 T cells. Box plots of the average scores for each treatment are shown with p-values compared to the IgG control for (F) GZMB and (G) IFNG. H and I) Exhaustion scores were generated by assessing a panel of 50 genes associated with (H) HAVCR2 (TIM3) expression or (I) PDCD1 (PD-1) expression in CD8 T cells in both naïve and progenitor exhausted cells. Box plots of the average scores for each treatment are shown with p-values compared to the control for (H) HAVCR2 and (I) PDCD1. All p-values were generated using a one-tailed t-test.
