
FIGURE 6: The bispecific antibody acts, in part, through strongly depleting BRD1 expression leading to increased immune activity through activation and state changes in T and NK cells:
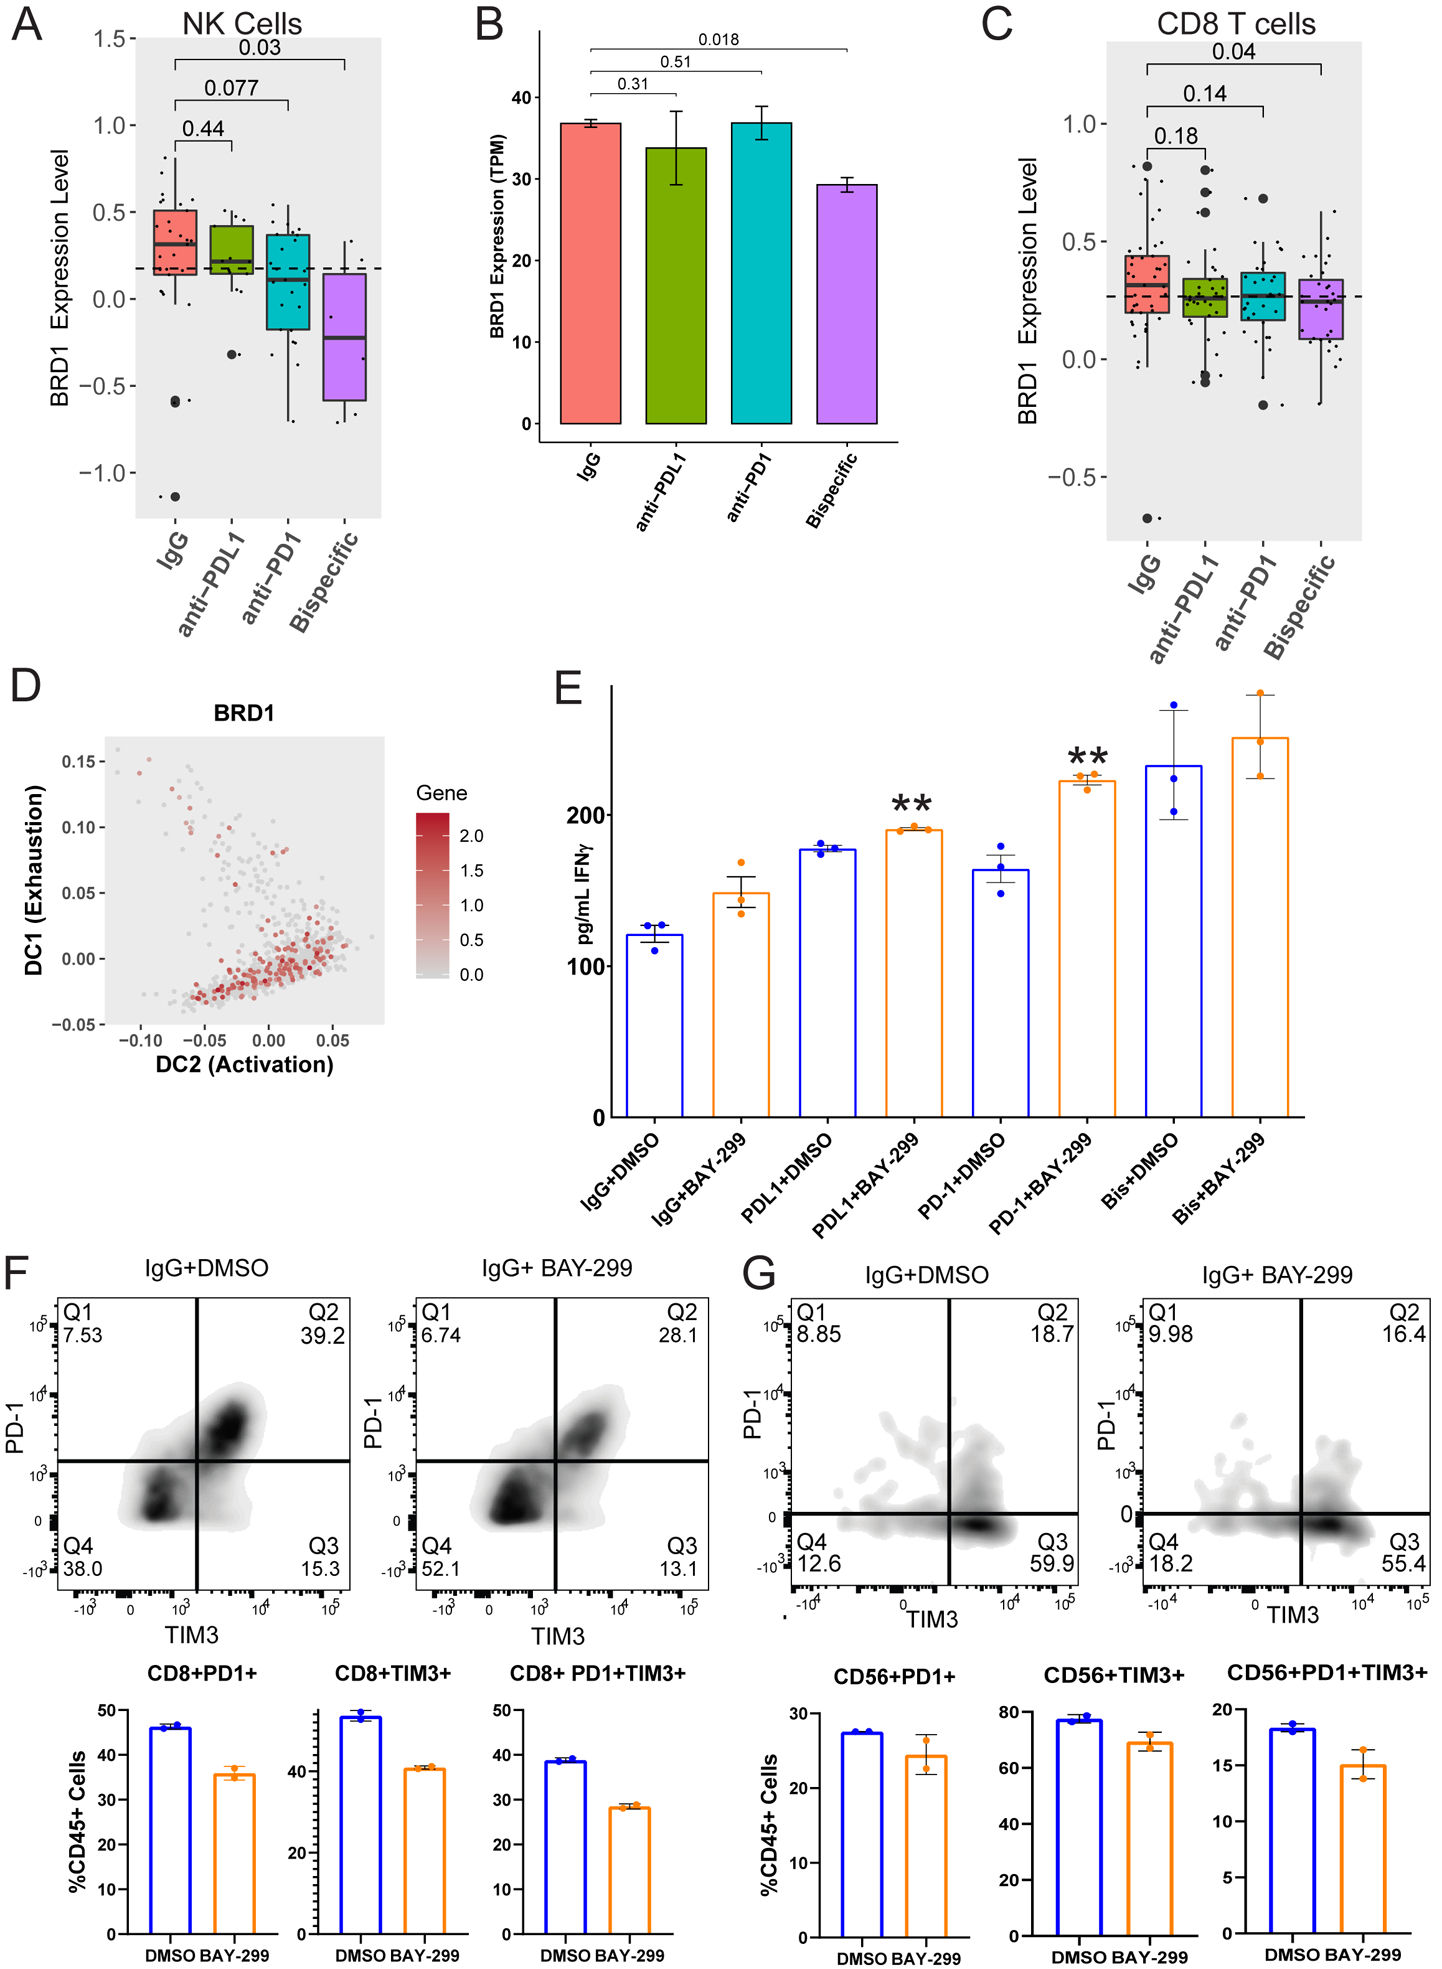
A) BRD1 expression was analyzed across different treatment groups from the scRNA-seq experiment (Figure 3) for NK cells. Bar graph demonstrating the expression level of BRD1 in NK cells for each ICB antibody compared to the IgG control. p-values were generated using a one-tailed t-test. B) To verify the BRD1 depletion induced by the bispecific antibody in NK cells, another organoid co-culture from an untreated HGSC patient (20–35) was treated with isotype control, anti-PD-1, anti-PD-L1, or anti-PD-1/PD-L1. NK cells were sorted from the treated cultures at the 96 hour timepoint and sent for bulk RNA sequencing. The BRD1 expression across treatments is shown here as transcripts per million (TPM). p-values were generated using a one-tailed t-test. C) BRD1 expression was analyzed across different treatment groups from the scRNA-seq experiment (Figure 3) for the naïve and progenitor exhausted CD8 T cell subgroups combined. Shown here is a bar graph demonstrating the expression level of BRD1 in the combined ICB responsive naïve and progenitor exhausted CD8 T cells compared to the IgG control. p-values were generated using a one-tailed t-test. D) Diffusion map demonstrating BRD1 expression in CD8 T cell subgroups transitioning between naïve and progenitor exhausted CD8s and terminally exhausted and progenitor exhausted CD8s (mapped in Figure 5B). The X axis represents increasing activation, and the Y axis represents increasing exhaustion. The color code for gene expression level is shown on the right. E) The same organoid co-culture from figure 6B (20–35) was treated with isotype control, anti-PD-1, anti-PD-L1, or anti-PD-1/PD-L1 combined with either DMSO (blue) or the BRD1 inhibitor BAY-299 (orange). The co-culture media supernatants underwent IFNγ ELISA analysis shown here as the average pg/mL of IFNγ for the treatment with error bars representing standard error. **p<0.005 F and G) The treated organoid co-cultures from Figure 6B and 6E underwent flow cytometry analysis for PD-1 and TIM3 single positive and double positive cells. Only the IgG and PD-L1 treated cultures could be analyzed here because the anti-PD-1 and bispecific antibody treated co-cultures show decreased PD-1 due to the treatment antibody blocking the flow antibody. F) The flow quadrant plots for IgG+DMSO and IgG+BAY-299 are shown for CD8 T cells on the top. PD-1 is on the Y axis and TIM3 is on the X axis. The percentage of PD-1 (Q1) and TIM3 (Q3) single positive and double positive (Q2) CD8 T cells is shown on the bottom as a percent of CD45 positive cells. Error bars represent standard error across two replicates. G) The flow quadrant plots for IgG+DMSO and IgG+BAY-299 are shown for NK cells on the top. PD-1 is on the Y axis and TIM3 is on the X axis. The percentage of PD-1 (Q1) and TIM3 (Q3) single positive and double positive (Q2) NK cells is shown on the bottom as a percent of CD45 positive cells. Error bars represent standard error across two replicates.