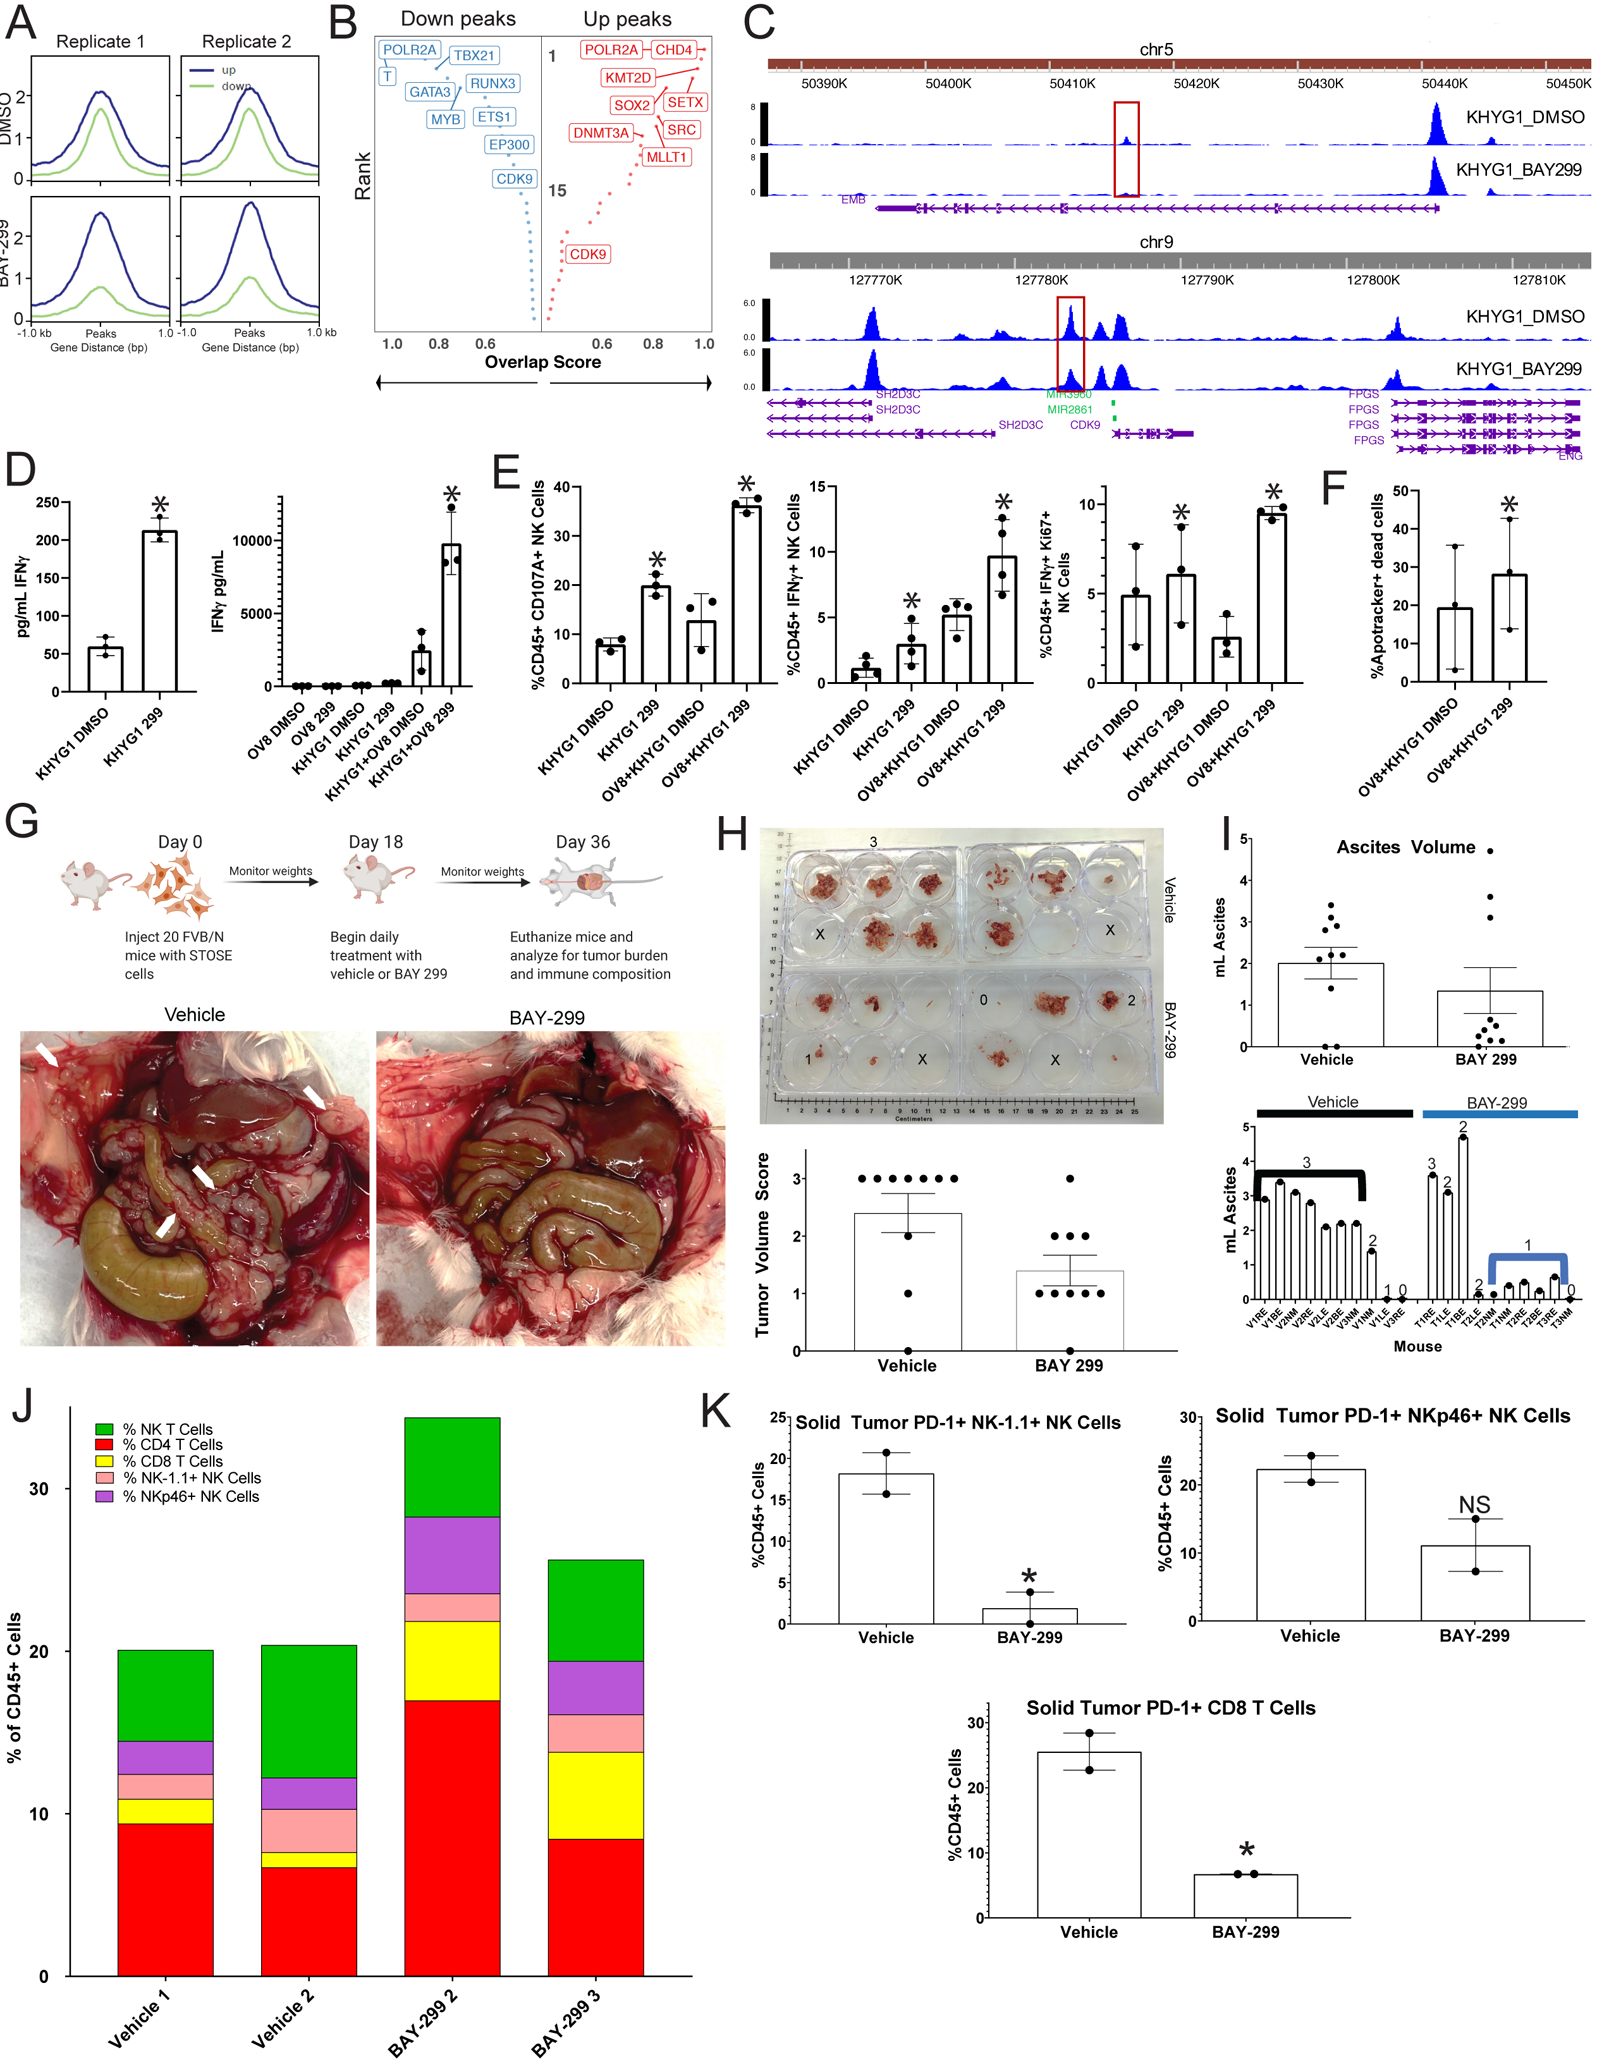
Figure 7: A BRD1 inhibitor causes increased anti-tumor immunity in HGSC by altering immune cell chromatin state:

A) ATAC-seq was performed in duplicate on KHYG1 cells treated with either vehicle or BAY-299. Aggregated reads within 1kb on either side of center for up (blue) and down (green) differentially accessible chromatin sites for the two replicates for DMSO (top) and BAY-299 (bottom) treated cells are shown here. B) The transcription factors (TF) associated with the most strongly altered up (right red) and down (left blue) peaks are shown here. The Y axis represents rank of the transcription factor from 1 (highest rank at top) to 30 (lowest rank at bottom) for number of overlapping sites, and the X axis represents the overlap score increasing from left to right for up peaks and right to left for down peaks. Highest ranking TFs are on the top left for down peaks and top right for up peaks. C) Chromatin peaks surrounding and within the EMB (top) and CDK9 (bottom) genomic locus for DMSO treated KHYG1 cells (top in each panel) and BAY-299 treated KHYG1 cells (bottom in each panel). The taller the peak the more open the chromatin. The scale for peak size is on the y-axis and the x axis represents location in the genome. D) KHYG1 cells treated with DMSO vehicle or BAY-299 (299) were plated either alone or in co-culture with OVCAR8 (OV8) tumor cells, and the media was subsequently tested for IFNγ presence by ELISA. Bar graphs for the ELISA for KHYG1 cells alone is shown on the left and for the co-cultures on the right. The error bars represent the standard deviation between three replicates of the experiment *=p<0.05 using a paired t-test. E) KHYG1 cells treated with vehicle DMSO or BAY-299 (299) were plated either alone or in co-culture with OVCAR8 (OV8) tumor cells, and the cultures were analyzed by flow cytometry for NK cell CD107A expression (left), IFNγ expression (middle), and IFNγ/Ki67co-expression (right). Error bars represent standard deviation between 3–4 replicates. *=p<0.05 using a paired t-test. F) KHYG1 cells treated with DMSO vehicle or BAY-299 (299) were plated in co-culture with OVCAR8 (OV8) tumor cells, and six hours later the OVCAR8 cells were analyzed for apoptotic death. The percentage of non-viable apoptotic cells (Apotracker+ Dead Cells) from three separate experiments is shown here for each group with error bars representing standard deviation. *=p<0.05 using a paired t-test. G) A schematic of the in vivo experiment is shown in the top panel. In the bottom panel, gross images of the tumor burden in vehicle and BAY-299 treated mice are shown with white arrows pointing to solid tumor deposits on the peritoneum and bowel. The animals shown are representative of the most common tumor burden levels in each group. H) Grossly visible solid tumors were dissected from each mouse in each group, and a photo of tumor volume is shown in the top panel. Solid tumors from each animal were placed in a well of a six well plate for visual volume scoring. A three represents high tumor burden, a two medium tumor burden, a one limited tumor burden, and a zero no tumor burden. Numbers are placed in representative 3, 2, 1, and 0 wells, and an X is placed in empty wells. In the bottom panel, the tumor volume scores are shown for all ten animals per group in a bar graph with error bars representing standard error of the mean (SEM). I) Ascites was aspirated from each animal and the volume measured. The top panel represents a bar graph of the ascites volumes for all animals in each group with the error bars representing SEM. The bottom panel shows the individual animal ascites volumes with the numeric tumor volume score for each animal over the volume bar. Black and blue lines mark the vehicle (V) and treatment (T) groups most common volume and tumor burdens. J) Solid tumors were harvested from each animal in both the vehicle and treatment groups. For each treatment group, the tumors for 3–4 animals were combined. There were only enough cells from two combined groups each for vehicle and BAY-299 to perform flow analysis. The single cell suspensions of the solid tumors were analyzed for T and NK composition which is shown here. Each color represents a cell type and each bar represents a group. The color code is at the top left. K) PD-1 expression was analyzed in both solid tumor treatment groups on NK-1.1+ NK cells (top left), NKp46+ NK cells (top right), and CD8 T cells (bottom), and the percent of PD-1+ T or NK cells for each treatment group is shown here as a percentage of CD45+ cells. Error bars represent standard deviation. *=p<0.05 generated using an unpaired t-test, NS=not significant with an unpaired t-test.
