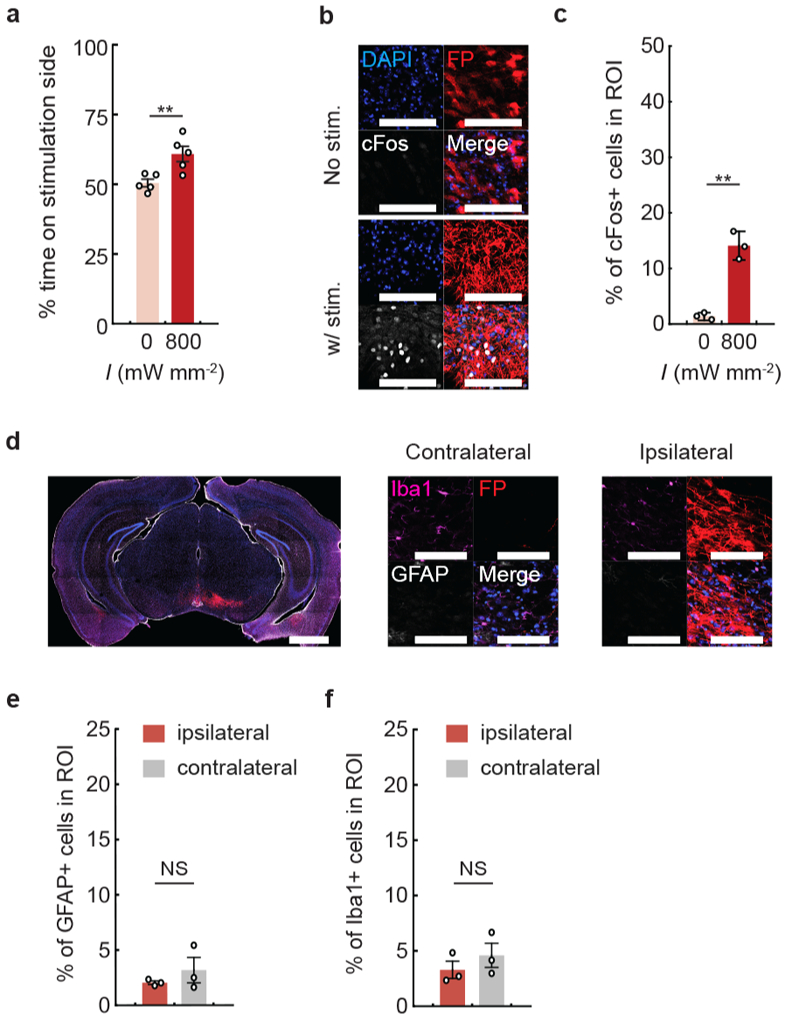
Extended Data Fig. 4 ∣. Evaluation of long-term expression of ChRmine at 7 months.

a, DAT-Cre mice following 7 months of ChRmine-oScarlet expression were subjected to a real-time place preference test with stimulation parameters at 800 mW mm−2, 500 ms ON/OFF at 20 Hz with 5-ms pulse width (5% duty cycle) (n = 5 mice; two-sided paired t-test, P = 0.003). b, Representative images of cFos expression with (bottom) or without (top) stimulation. Scale bar: 100 μm. c, Percentage of cFos+ cells among DAPI-labeled cells in the VTA. Mice were sacrificed 90 minutes following 10 minutes of transcranial photostimulation at 0 or 800 mW mm−2 laser delivered at 20 Hz and 5-ms pulse width (n = 3 per group; two-sided unpaired t-test, P = 0.001). d, Representative confocal image of neurons in the VTA expressing ChRmine-oScarlet (red fluorescent protein (FP)), stained with DAPI (blue, separate channel not shown), Iba1+ microglia (magenta), and GFAP+ astrocytes (white) used to assess glia distribution within the injection (ipsilateral) and contralateral side. Scale bar: 1 mm and 100 μm. Percentage of astrocytes (e) and microglia (f) among DAPI-labeled cells. No statistical difference in glial accumulation was observed in the VTA with (ipsilateral) or without (contralateral) local ChRmine expression (n = 3 per group; two-sided unpaired t-test, P = 0.38 (e and f)). **P < 0.01; NS, not significant. Data are mean ± sem.
