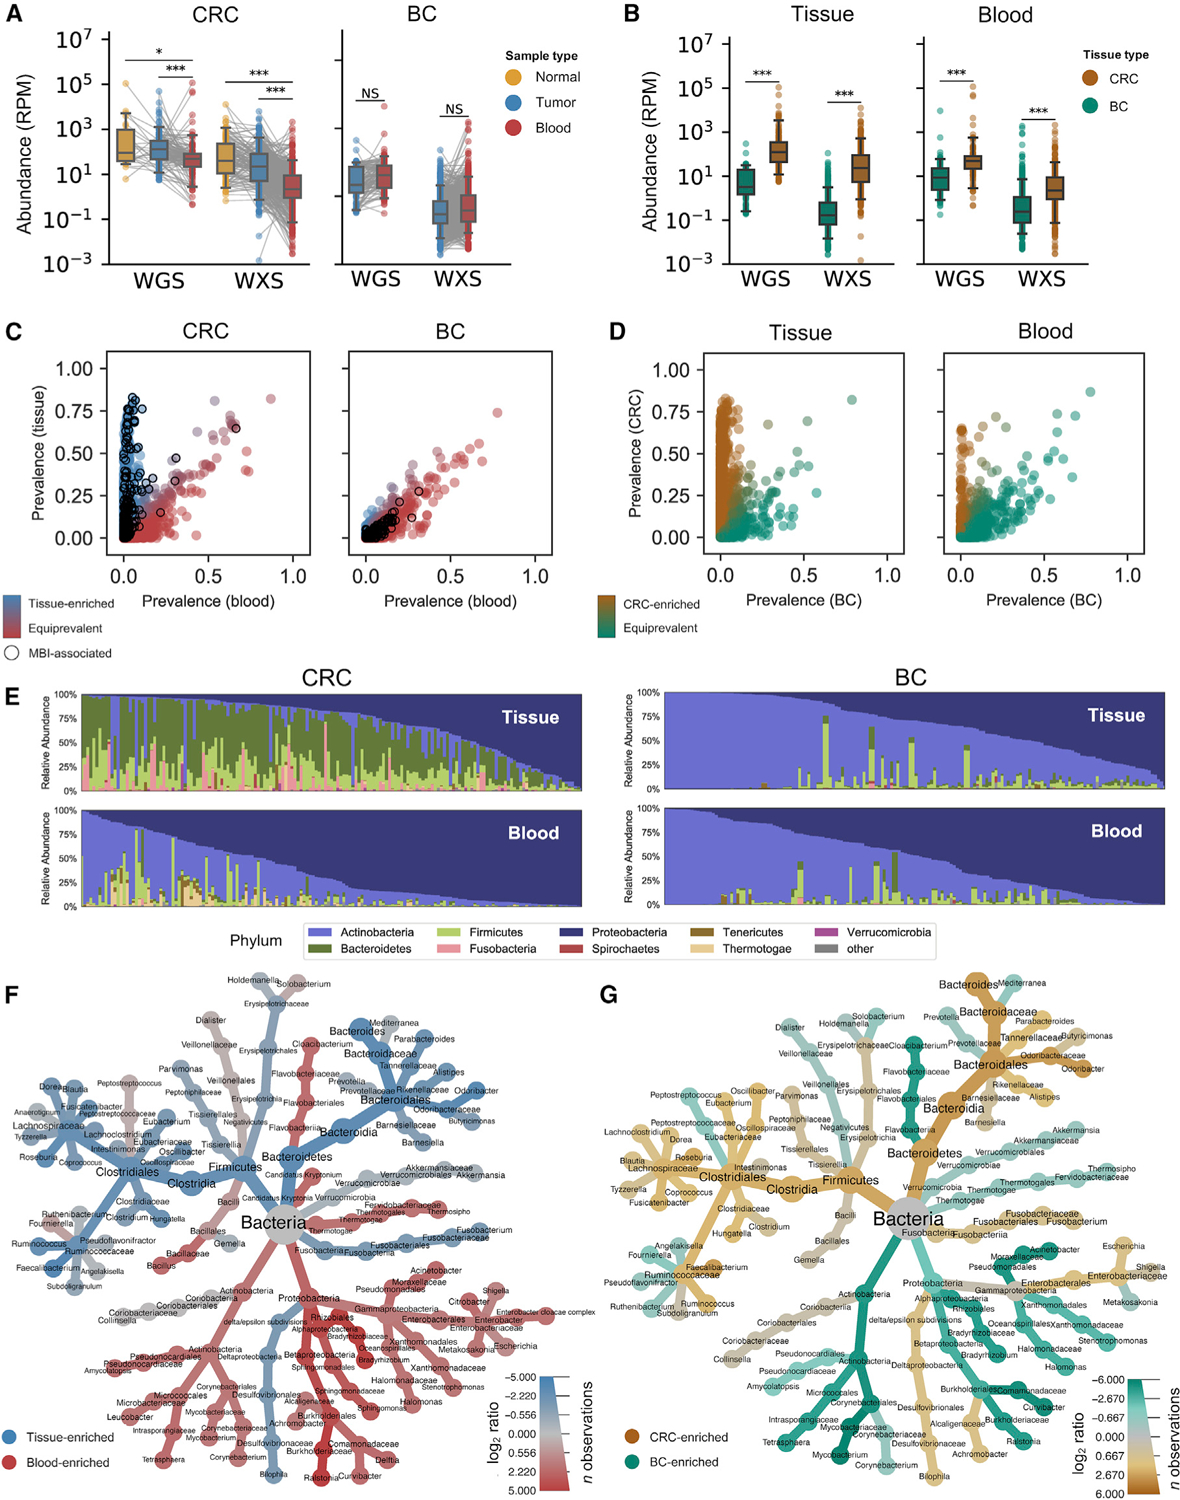
Figure 1. WGS and WXS harbor colorectal bacterial reads distinct from blood and brain.

See also Figure S1
(A) Matched analysis of bacterial sequencing reads per million (RPM) in normal tissue (yellow), tumor tissue (blue), and blood (red) from CRC and BC patients in TCGA. Significance is given by paired, one-sided t tests.
(B) Abundance data from (A) but comparing solid tissue (pooled tumor and normal) with blood samples from BC (green) and CRC (brown) patients. Significance is given by one-sided t tests.
(C) Comparison of bacterial species prevalence in WGS data for CRC blood and CRC tissue samples reveals populations of tissue-enriched species (blue) and species that are equiprevalent in blood and tissue (red). Black circles denote species associated with MBI.
(D) Comparison of bacterial species prevalence in WGS data for CRC and BC samples reveals populations of CRC-enriched species (brown) and species that are equiprevalent in CRC and BC (green).
(E) Relative abundance of bacterial phyla in WGS data for tissue (top) and blood (bottom) samples from CRC (left) and BC (right) patients.
(F and G) Heat tree comparing relative abundance of bacteria in WGS data for (F) matched blood samples (red) versus tissue samples (blue) and (G) CRC tissue (brown) versus BC tissue (green).
