
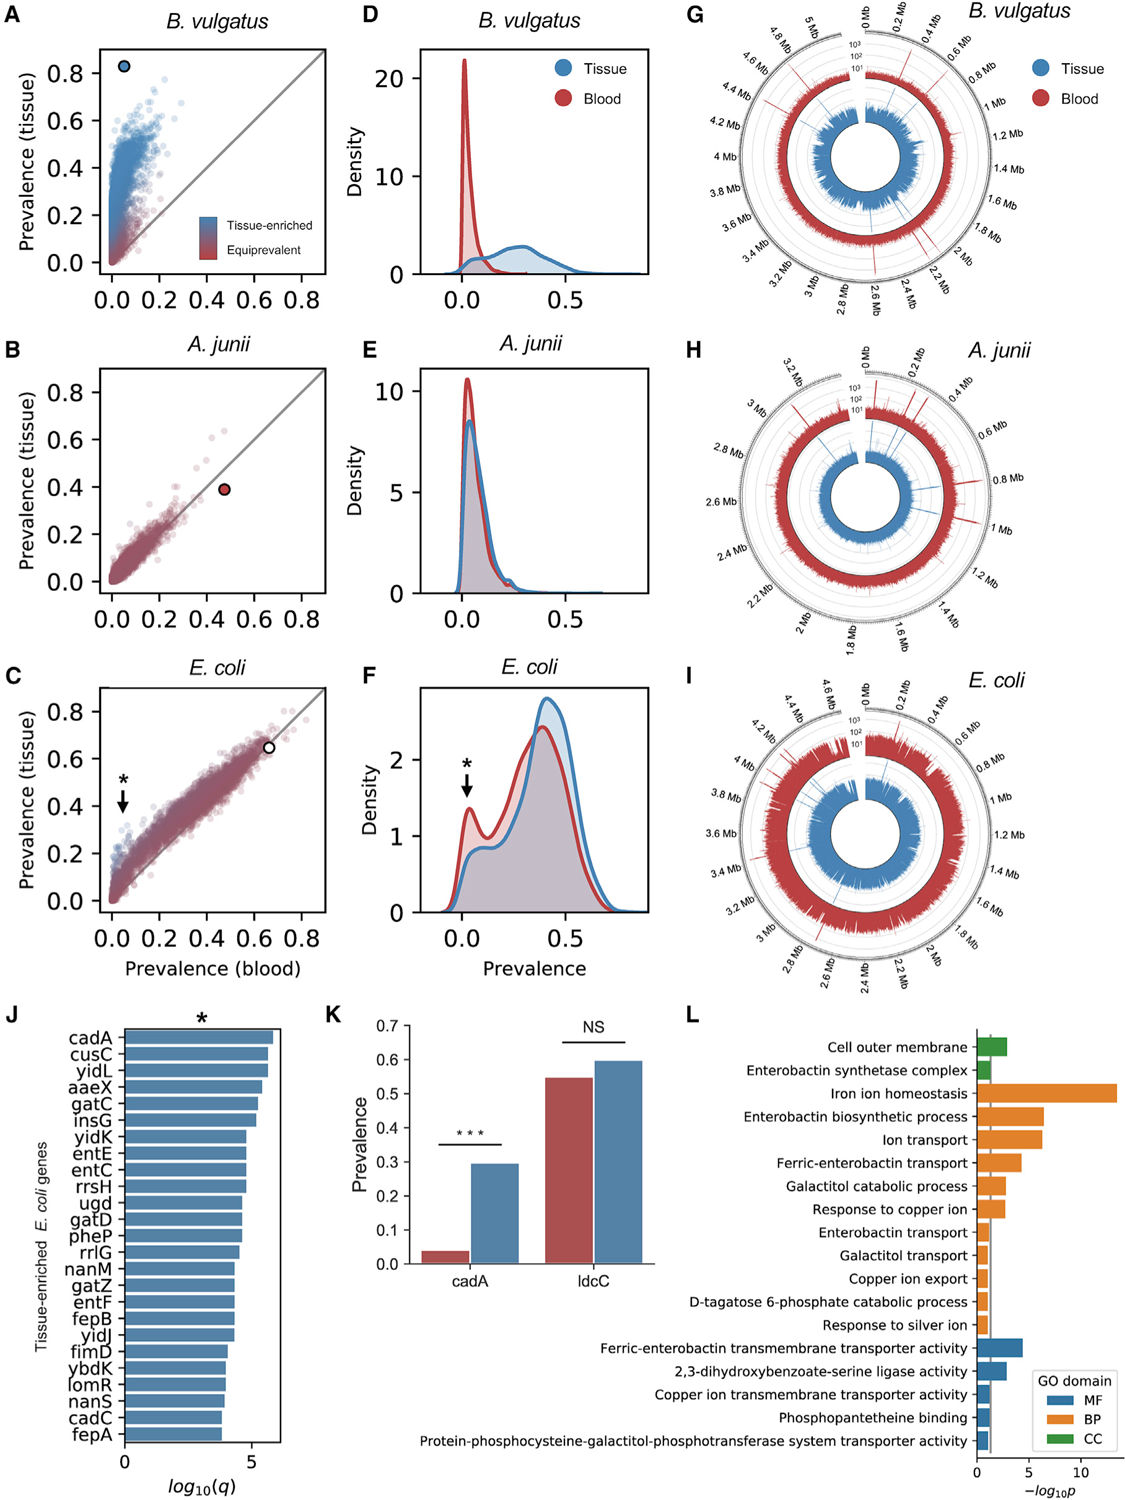
Figure 3. Detecting tissue-resident and contaminant species with gene-level resolution.
See also Figure S3
(A–C) Prevalence of genes belonging to B. vulgatus (A; tissue-resident), A. junii (B; contaminant), and E. coli (C; mixed-evidence) in blood versus tissue. The large dot indicates species-level prevalence.
(D–F) Kernel-density estimate of gene prevalence in blood (red) and tissue (blue) for B. vulgatus (A), A. junii (B), and E. coli (F).
(G–I) Coverage of WGS reads aligning to genomes of B. vulgatus (G), A. junii (H), and E. coli (I) in blood (red) and tissue (blue).
(J) Top 25 E. coli genes most significantly enriched in tissue.
(K) Comparison of the prevalence of E. coli genes, cadA and ldcC, in blood (red) and tissue (blue).
(L) Results of GO pathway analysis of tissue-enriched E. coli genes.
*Indicates tissue-enriched E. coli genes