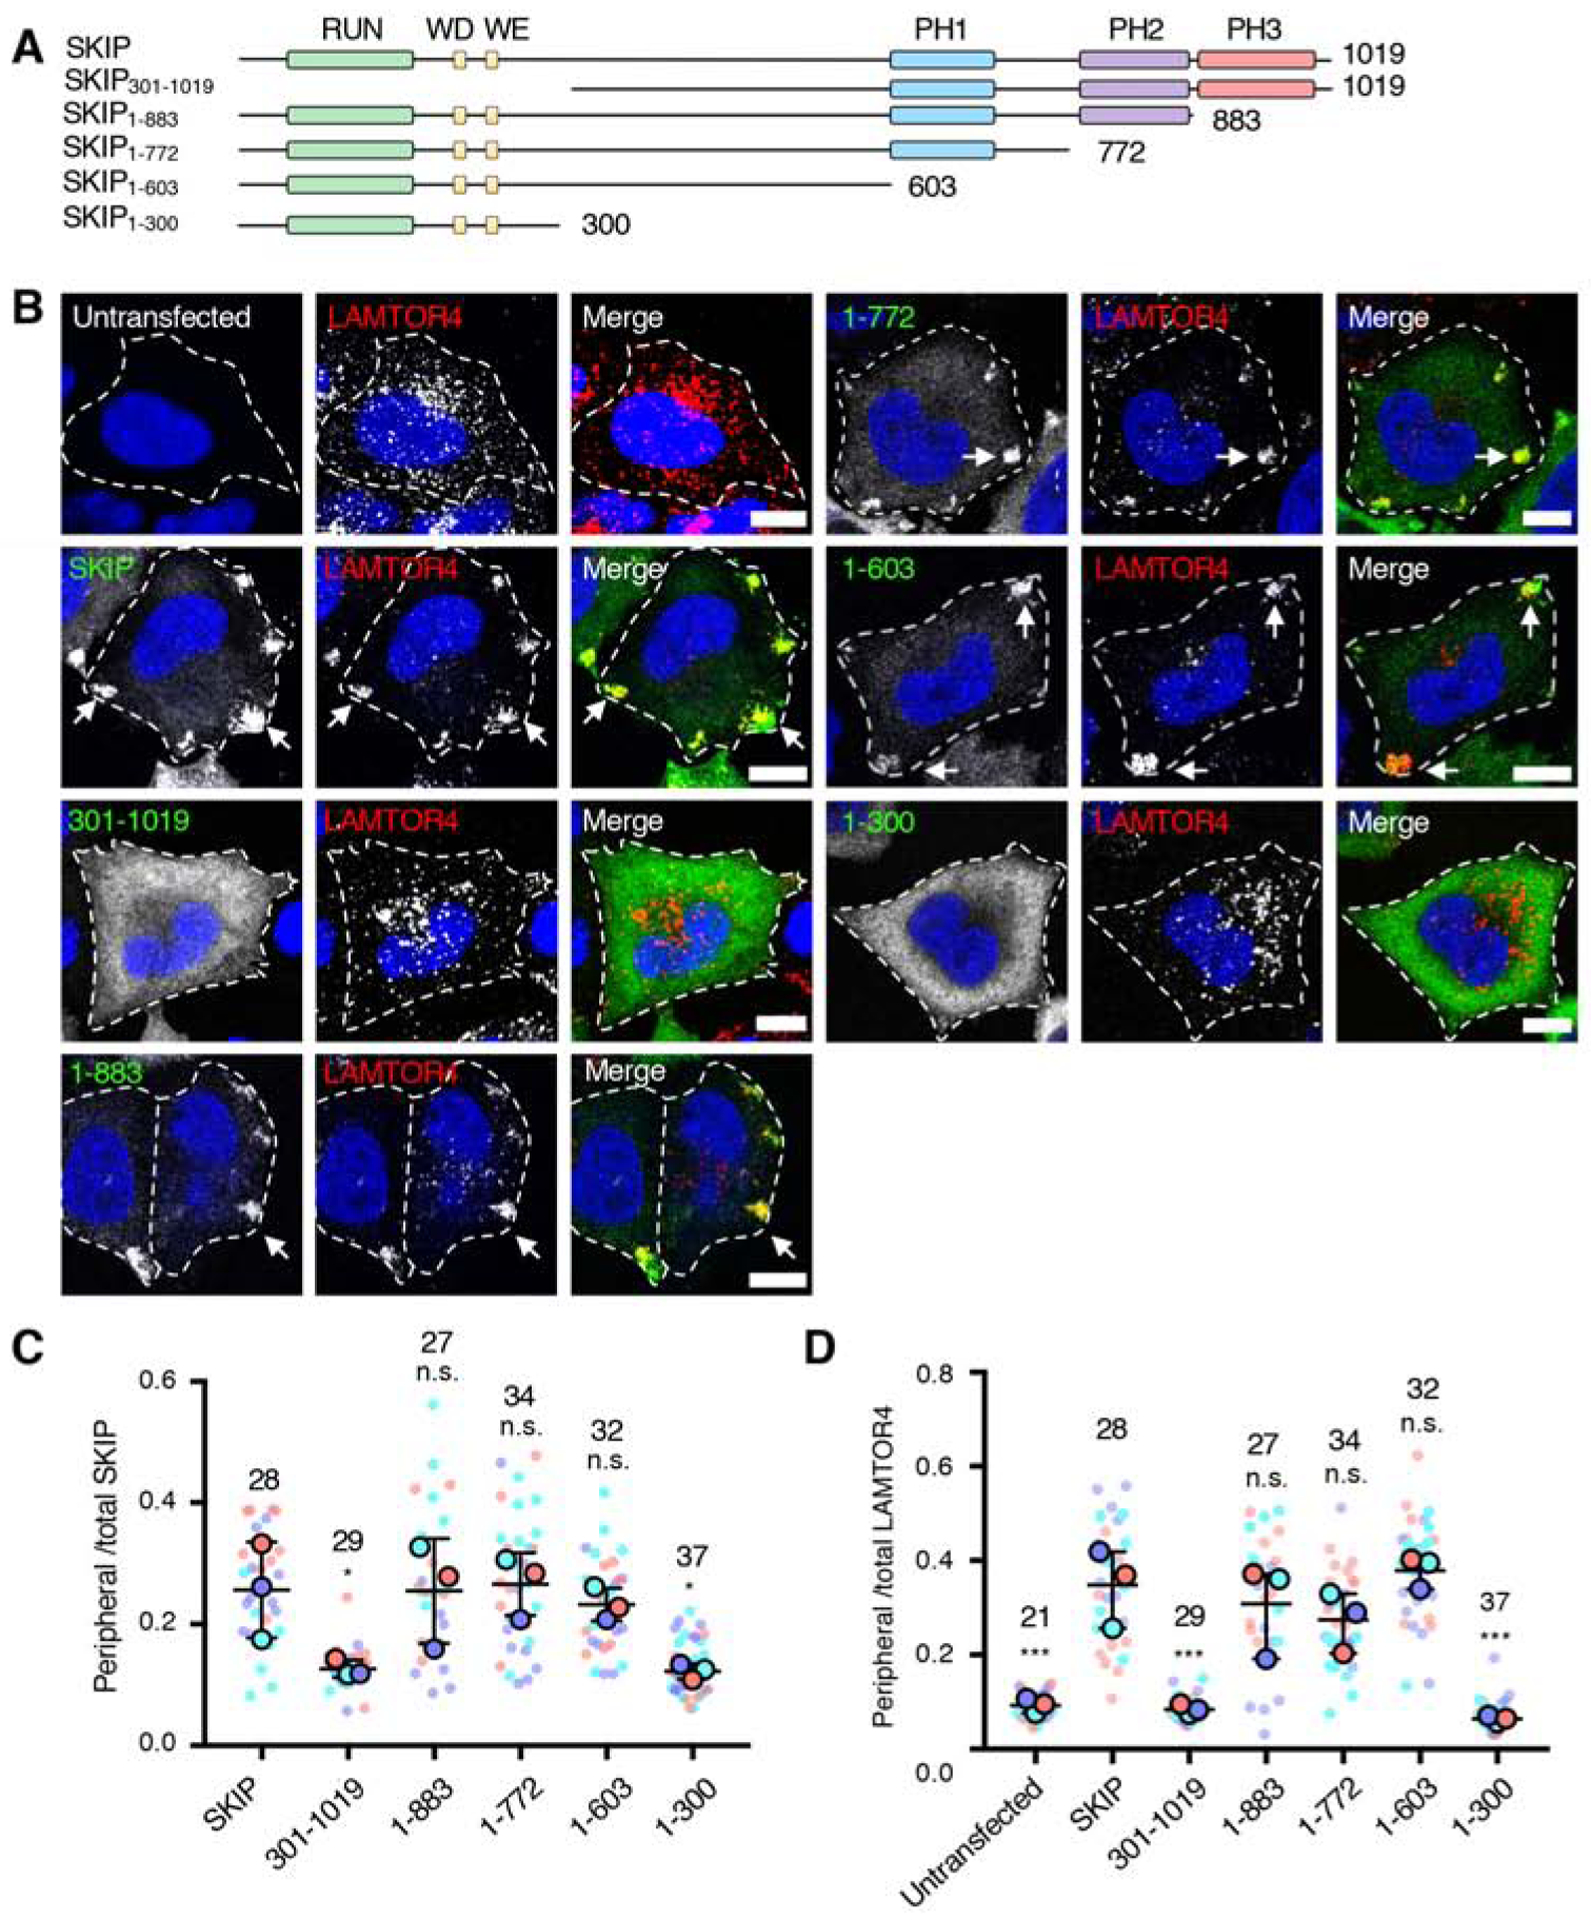
Figure 2. Effect of SKIP Deletions on Lysosome Positioning.

(A) Schematic representation of the SKIP deletion constructs used in these experiments. Domain organization of SKIP is as described in the legend to Figure 1. The constructs were tagged with a Myc epitope at the N-terminus.
(B) Confocal immunofluorescence microscopy of WT HeLa cells transfected with plasmids encoding the Myc-SKIP constructs represented in panel A, and co-immunostained with antibodies to the Myc epitope (green channel) and to the lysosomal marker LAMTOR4 (red channel). Nuclei were stained with DAPI (blue). Single channels are shown in grayscale with nuclei in blue. Cell edges are outlined. Arrows point to accumulation of Myc-SKIP and LAMTOR4 at cell vertices. Scale bars: 10 μm.
(C,D) Quantification of the ratio of peripheral to total Myc-SKIP constructs (C) and endogenous LAMTOR4 (D) from experiments such as those shown in panel B, represented as SuperPlots [60]. Peripheral fluorescence refers to the presence of the proteins at cell vertices. Horizonal lines indicate the mean ± SD of the means from 3 independent experiments. Experiments are color coded. Big circles represent the mean and small dots the individual data points from each experiment. The total number of cells analyzed is indicated on top of each value. Statistical significance was calculated by one-way ANOVA followed by multiple comparisons to Myc-SKIP-expressing cells using Dunnett’s test. Not significant (n.s.) P>0.05, *P<0.05, ***P<0.001.
