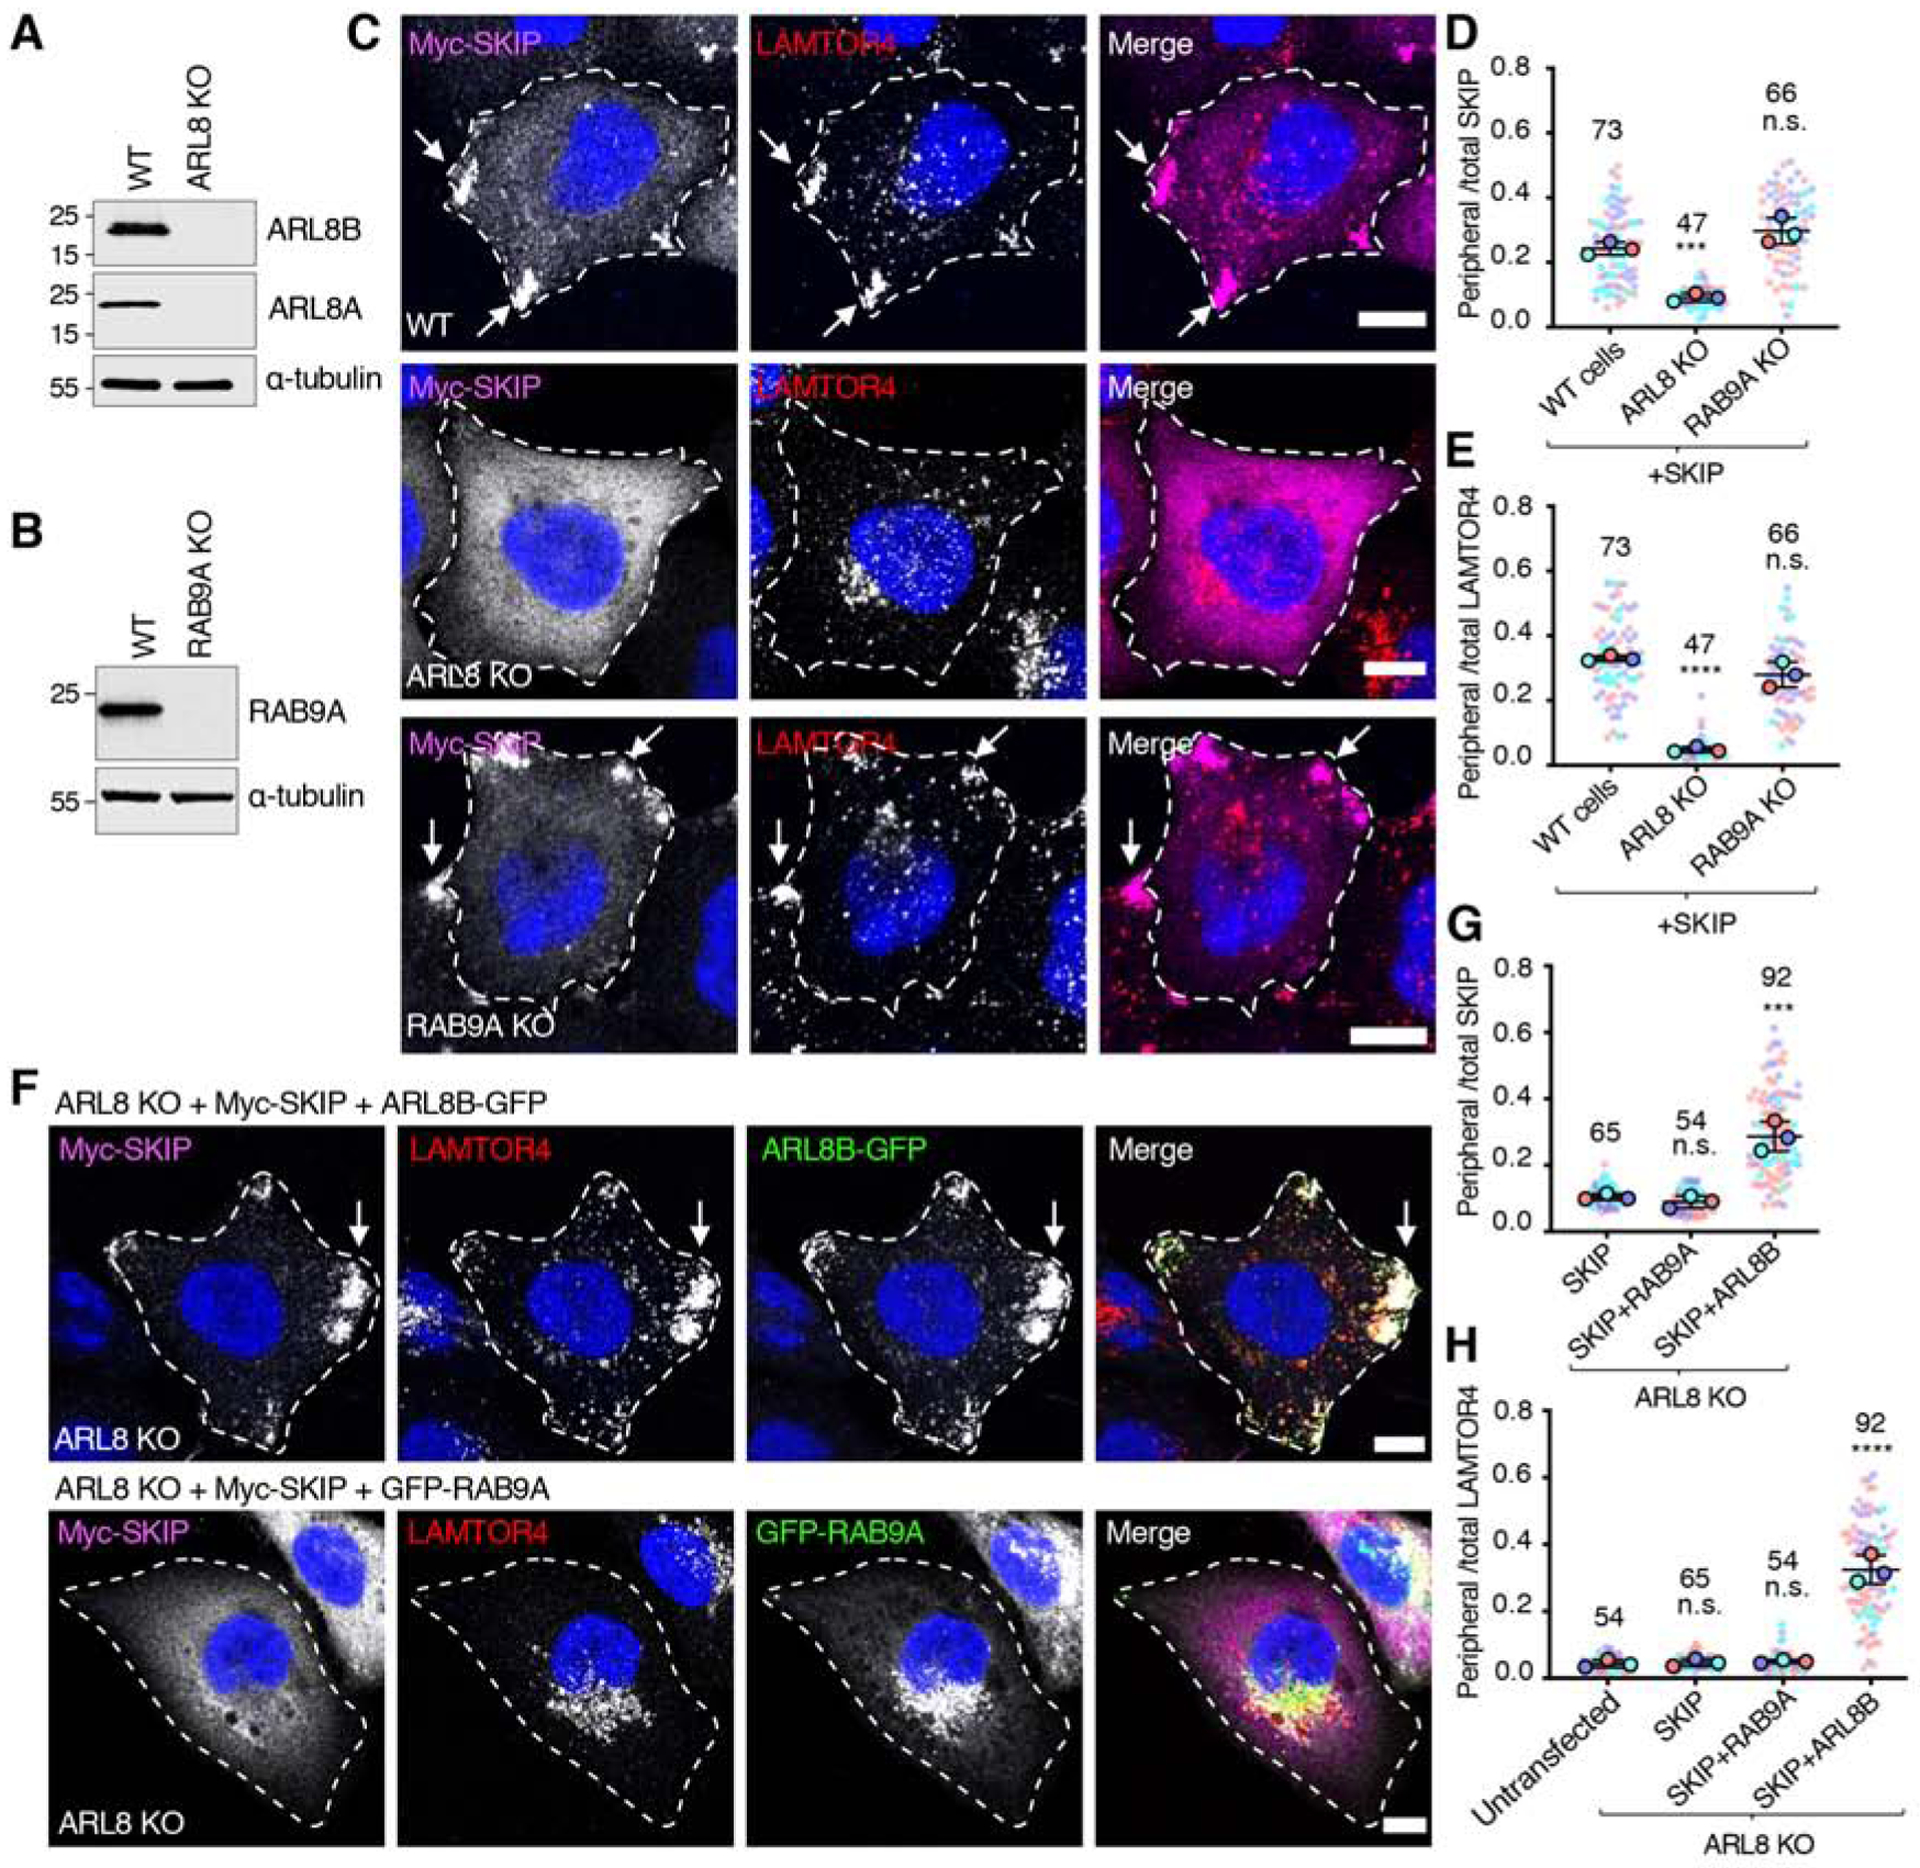
Figure 3. Analysis of the Requirement of ARL8 and RAB9A for SKIP function.

(A) Immunoblot analysis of WT and ARL8A-ARL8B-KO (referred to as ARL8-KO) HeLa cells with antibodies to ARL8A, ARL8B and α-tubulin (loading control).
(B) Immunoblot analysis of WT and RAB9A-KO HeLa cells with antibodies to RAB9A and α-tubulin (loading control). In A and B, numbers on the left indicate the positions of molecular mass markers (in kDa).
(C) Confocal immunofluorescence microscopy of WT, ARL8-KO and RAB9A-KO HeLa cells transfected with a plasmid encoding Myc-SKIP and co-immunostained with antibodies to the Myc epitope (magenta) and the lysosomal marker LAMTOR4 (red). Nuclei were stained with DAPI (blue). Single channels are shown in grayscale with nuclei in blue. Cell edges are outlined. Arrows indicate accumulation of Myc-SKIP and LAMTOR4 at cell vertices. Scale bars: 10 μm.
(D,E) Quantification of the ratio of peripheral to total Myc-SKIP (D) and endogenous LAMTOR4
(E) from experiments such as those shown in panel C, calculated and represented as described in the legend to Figure 2C. Not significant (n.s.) P>0.05, ***P<0.001, ****P<0.0001.
(F) Confocal immunofluorescence microscopy of ARL8-KO cells co-transfected with plasmids encoding Myc-SKIP together with ARL8B-GFP or GFP-RAB9A. Cells were co-immunostained with antibodies to the Myc epitope (magenta) and to the lysosomal marker LAMTOR4 (red). GFP fluorescence is shown in the green channel. Nuclei were stained with DAPI (blue). Single channels are shown in grayscale with nuclei in blue. Cell edges are outlined. Arrows indicate accumulation of Myc-SKIP and LAMTOR4 at cell vertices. Scale bars: 10 μm. The related Figure S1 shows the effect of expressing constitutively active ARL8B-GFP-Q75L and inactive ARL8BGFP-T34N on Myc-SKIP function in ARL8-KO cells.
(G,H) Quantification of the ratio of peripheral to total Myc-SKIP (G) and endogenous LAMTOR4 (H) from experiments such as those shown in panel F, calculated and represented as described in the legend to Figure 2C. Not significant (n.s.) P>0.05, ***P<0.001, ****P<0.0001.
