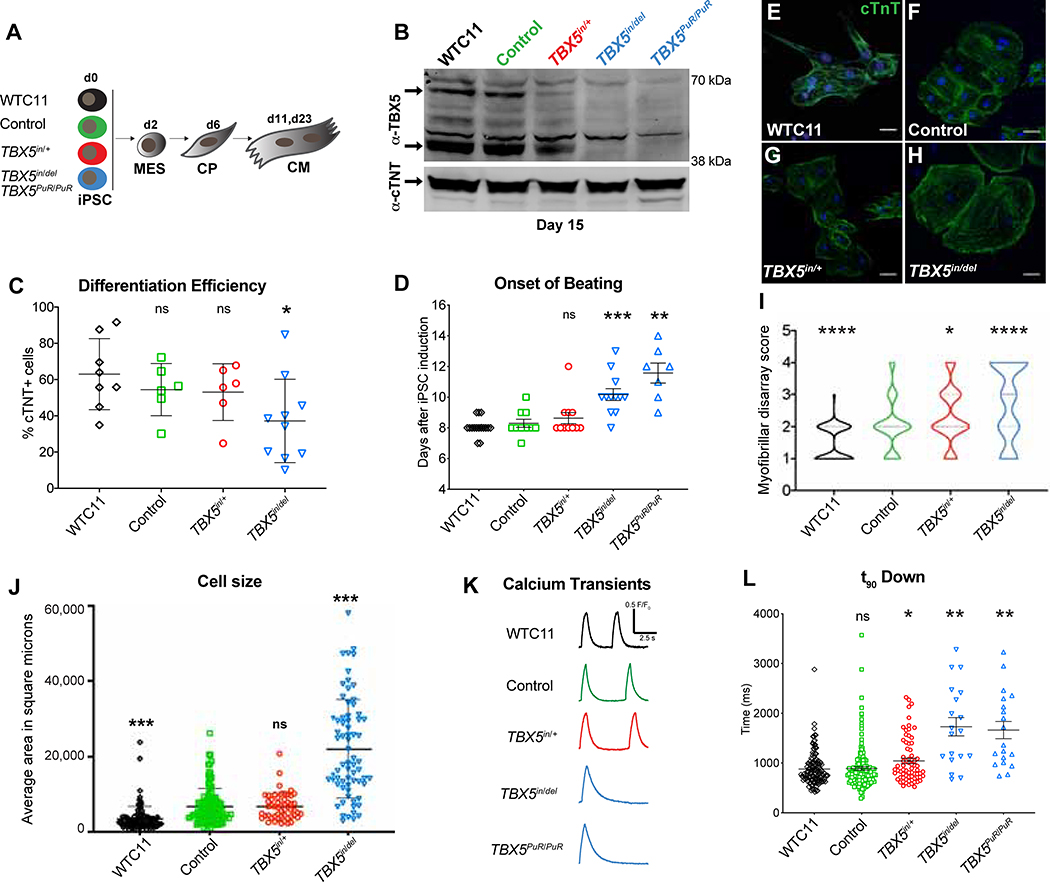
Figure 1. A human allelic series of TBX5 mutants model features of congenital heart disease.
(A) Experimental cell lines and strategy. (B) TBX5 and cTNT protein expression at day 15. (C) Differentiation efficiency by flow cytometry for cTNT+ cells (* p<0.05 by unpaired t test). (D) Onset of beating (** p<0.01, *** p<0.001 by unpaired t test). (E-I) Myofibrillar arrangement of cardiomyocytes (* p<0.05, **** p<0.0001 by Fisher’s exact test, compared to control). (J) Cell size (*** p<0.001 by unpaired t-test, compared to control). (K) Traces of calcium transients. (L) Time at 90% decay (t90 down) (* FDR<0.05, ** FDR<0.01). Error bars represent standard deviation (J, K) or standard error (L, M) of the mean.

