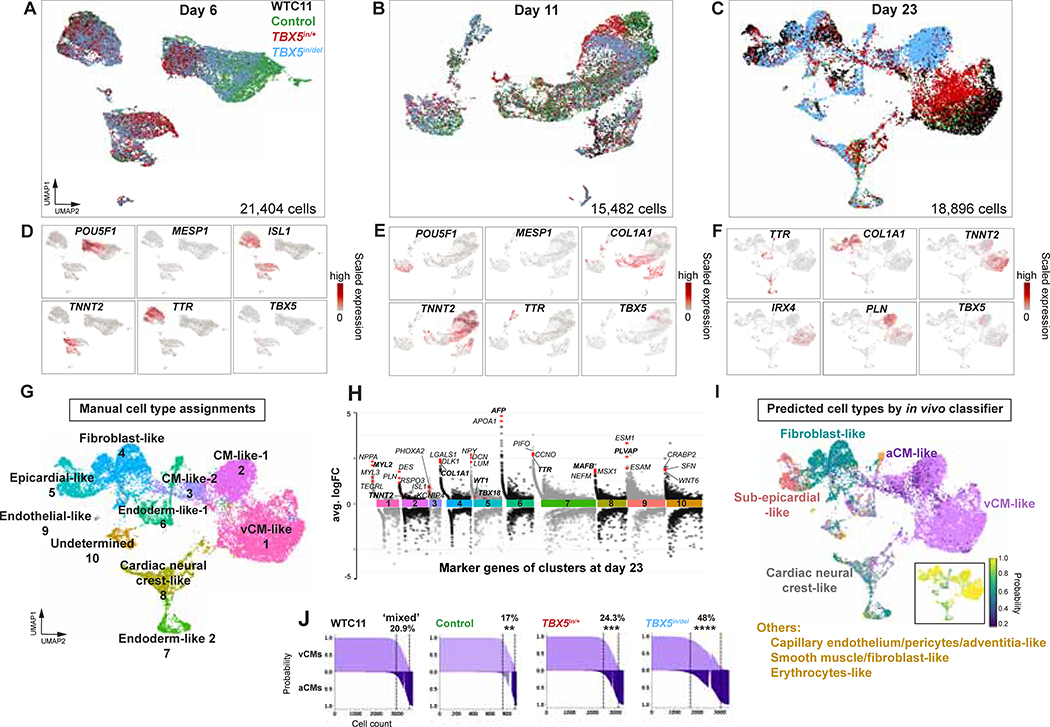
Figure 2. Human cardiomyocyte differentiation is sensitive to reduced TBX5 dosage.
(A-C) UMAPs display cells of TBX5 genotypes at day 6, day 11 or day 23. (D-F) Feature plots of selected marker genes, which represent major cell types at each timepoint. (G) Cell type assignments of iPSC-derived cells at day 23 by manual annotation. (H) Manhattan plot displays differentially expressed genes by cell type cluster at day 23. Example genes by cluster are shown. Manual annotation was based on expression of bolded genes. (I) Classifier prediction of cell types at day 23. Inset: Prediction probabilities. (J) Prediction probabilities of iPSC-derived cells classified as ventricular cardiomyocytes (vCM), atrial cardiomyocytes (aCM) or mixed (<0.95 probability difference of vCM and aCM). ** p<0.01, *** p<0.001, **** p<0.0001 by Fisher’s exact test.

