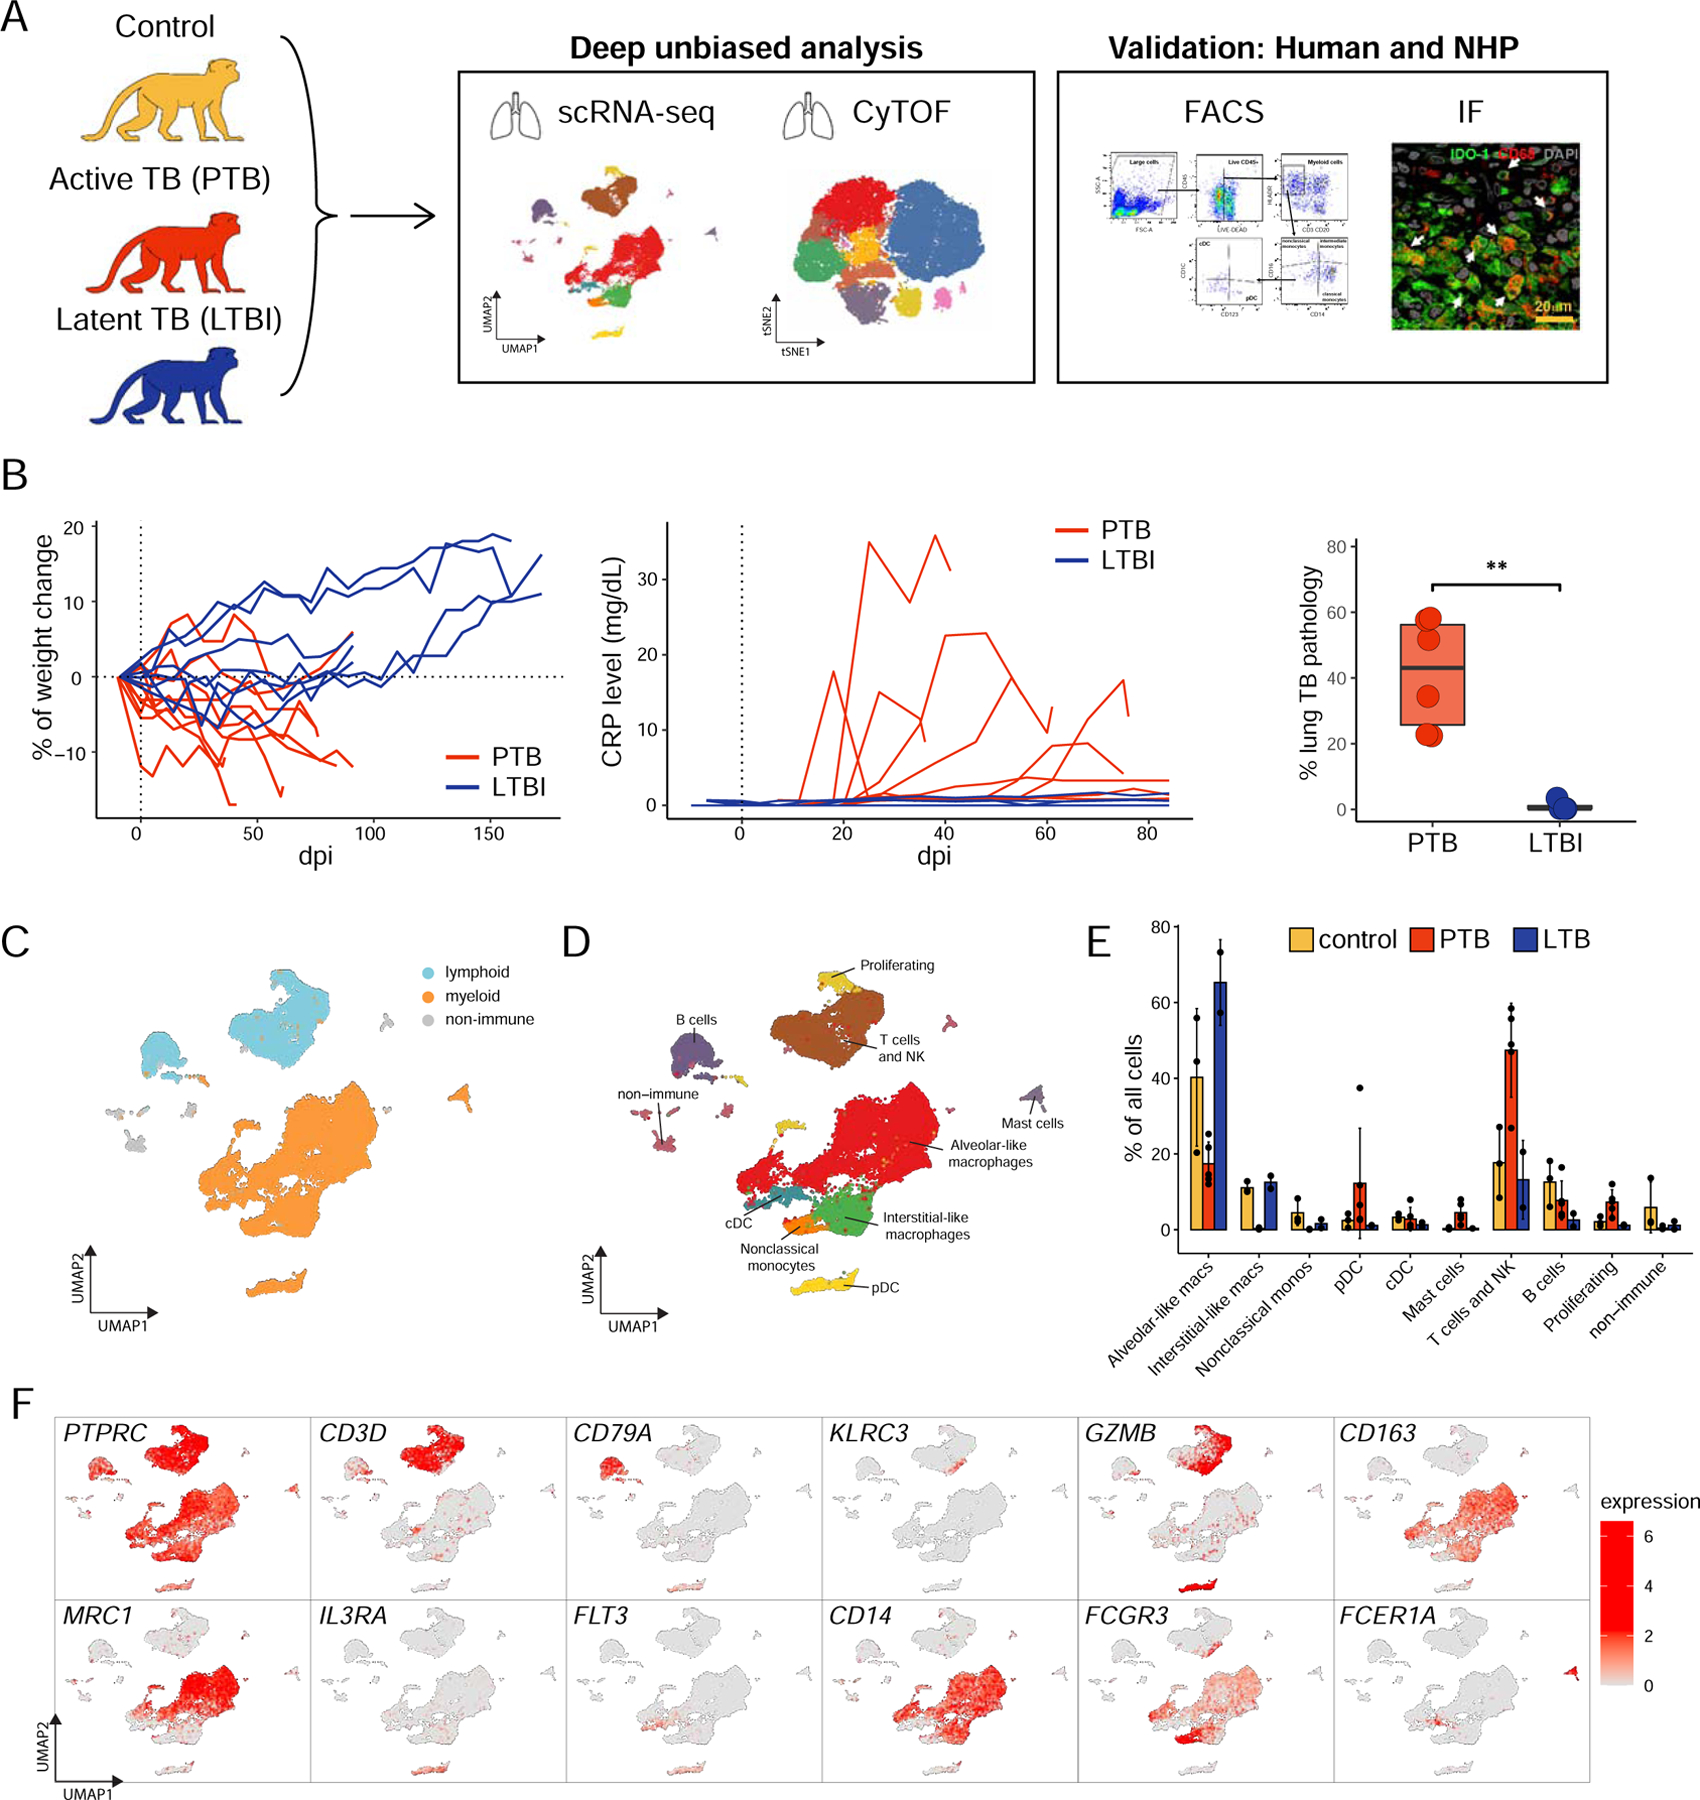
Figure 1. Study outline of rhesus macaques with LTBI and PTB.

A. Single cell suspensions of lung biopsy from uninfected rhesus macaques (control), macaques with PTB at terminal end-point, or LTBI at 6 months were subjected to scRNA-seq or CyTOF analysis as described in STAR methods.
B. Clinical correlates of infection including changes in the percentage of body weight, changes in serum CRP (mg/dL) levels, and post-necropsy percent of lung pathology in Mtb-infected LTBI and PTB macaques. Data represented as mean ± SD, **p < 0.01, unpaired Student’s T-test.
C-D. UMAP plots of cells from all scRNA-seq samples together, colored according to (C) lymphoid/myeloid classification or (D) cell types. Control, n=3; PTB, n=5; LTBI, n=2.
E. Proportion of each cell type across samples.
F. UMAP plots with the expression of markers, characterizing main immune populations. See also Fig S1, Table S1 and Table S2.
