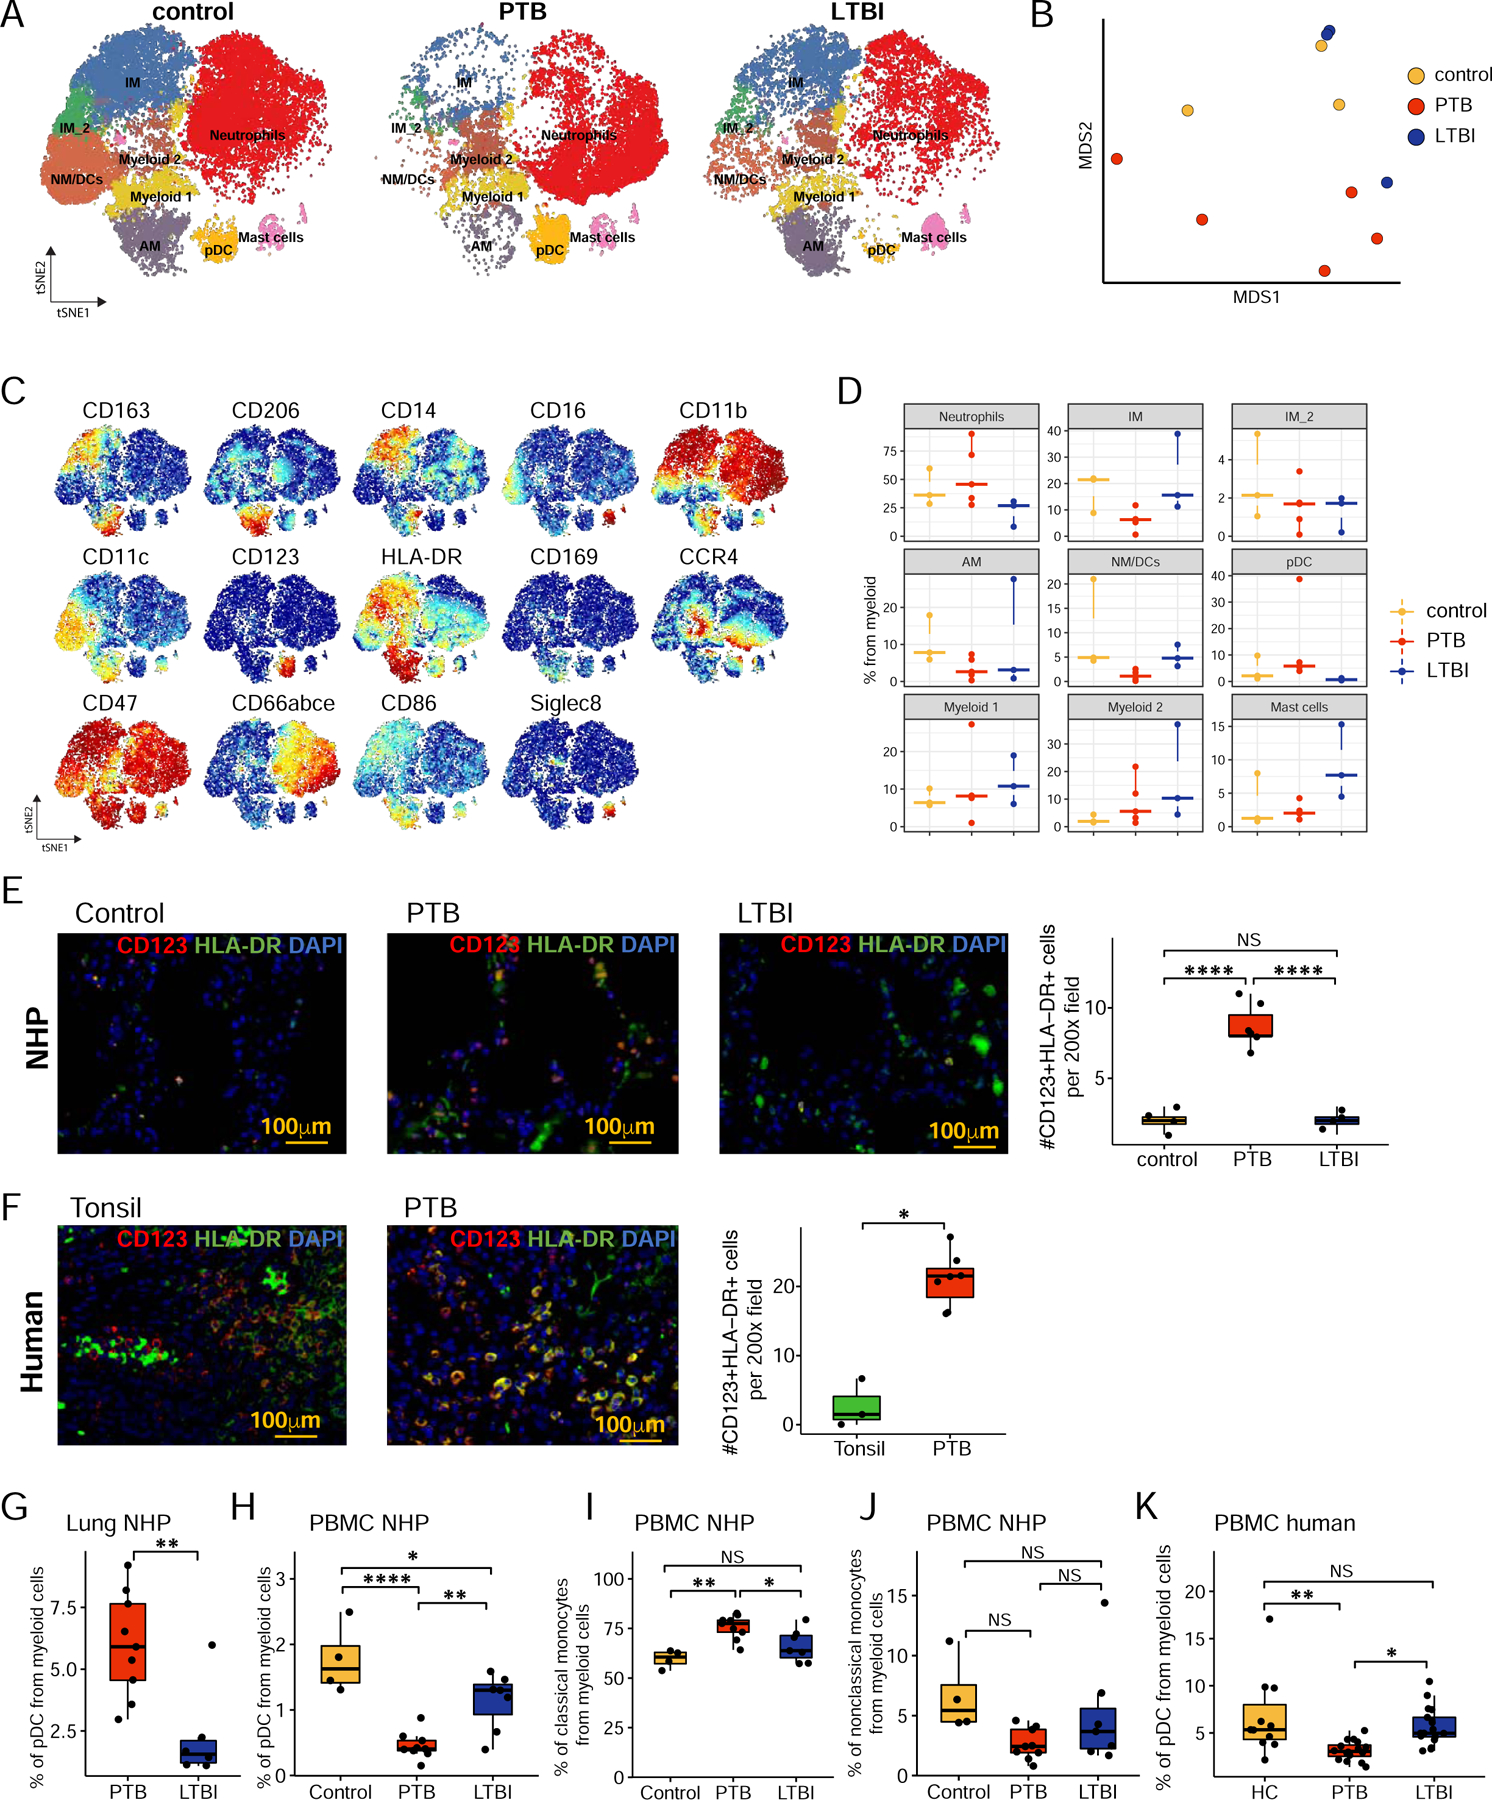
Figure 5. CyTOF and flow cytometry profiling of myeloid cells validates the accumulation of pDCs in macaque lungs with PTB.

A. tSNE plots of myeloid cells across all samples, colored according to identified clusters. Control, n=3; PTB, n=5; LTBI, n=3.
B. MDS projection of CyTOF samples, colored by the condition. For each sample, mean marker expression was used to perform MDS.
C. tSNE plots with the expression of all markers used to perform tSNE and identify clusters for myeloid cells.
D. Cell proportion of each cluster per condition.
E and F. Immunohistochemistry staining of CD123, HLA-DR, and DAPI on formalin-fixed paraffin-embedded sections from macaque lung (control; n=4, PTB: n=6 and LTBI; n=4) and human tissues (tonsils, n=3 and lung tissue from individuals with PTB, n=6). The right panel displays the morphometrical quantification of CD123+HLA-DR+ cell numbers across subjects.
G. Percentage of pDC in lung single cell suspension from PTB (n=9) and LTBI (n=6) macaques by flow cytometry.
H-J. Percentage of pDC (H), classical (I) and non-classical (J) monocytes in PBMCs from control (n=4), PTB (n=9) and LTBI (n=6) macaques by flow cytometry.
K. Percentage of pDC was determined in PBMCs from HC (n=11), LTBI (n=17) and PTB (n=16) patients by flow cytometry.
Data represented as mean ± SD, *p < 0.05, **p < 0.01, ***p < 0.001, NS = not significant, either by unpaired Student’s T-test (F, G) or by one-way ANOVA with Tukey post-hoc test (E, H-K).
