
Figure 8.
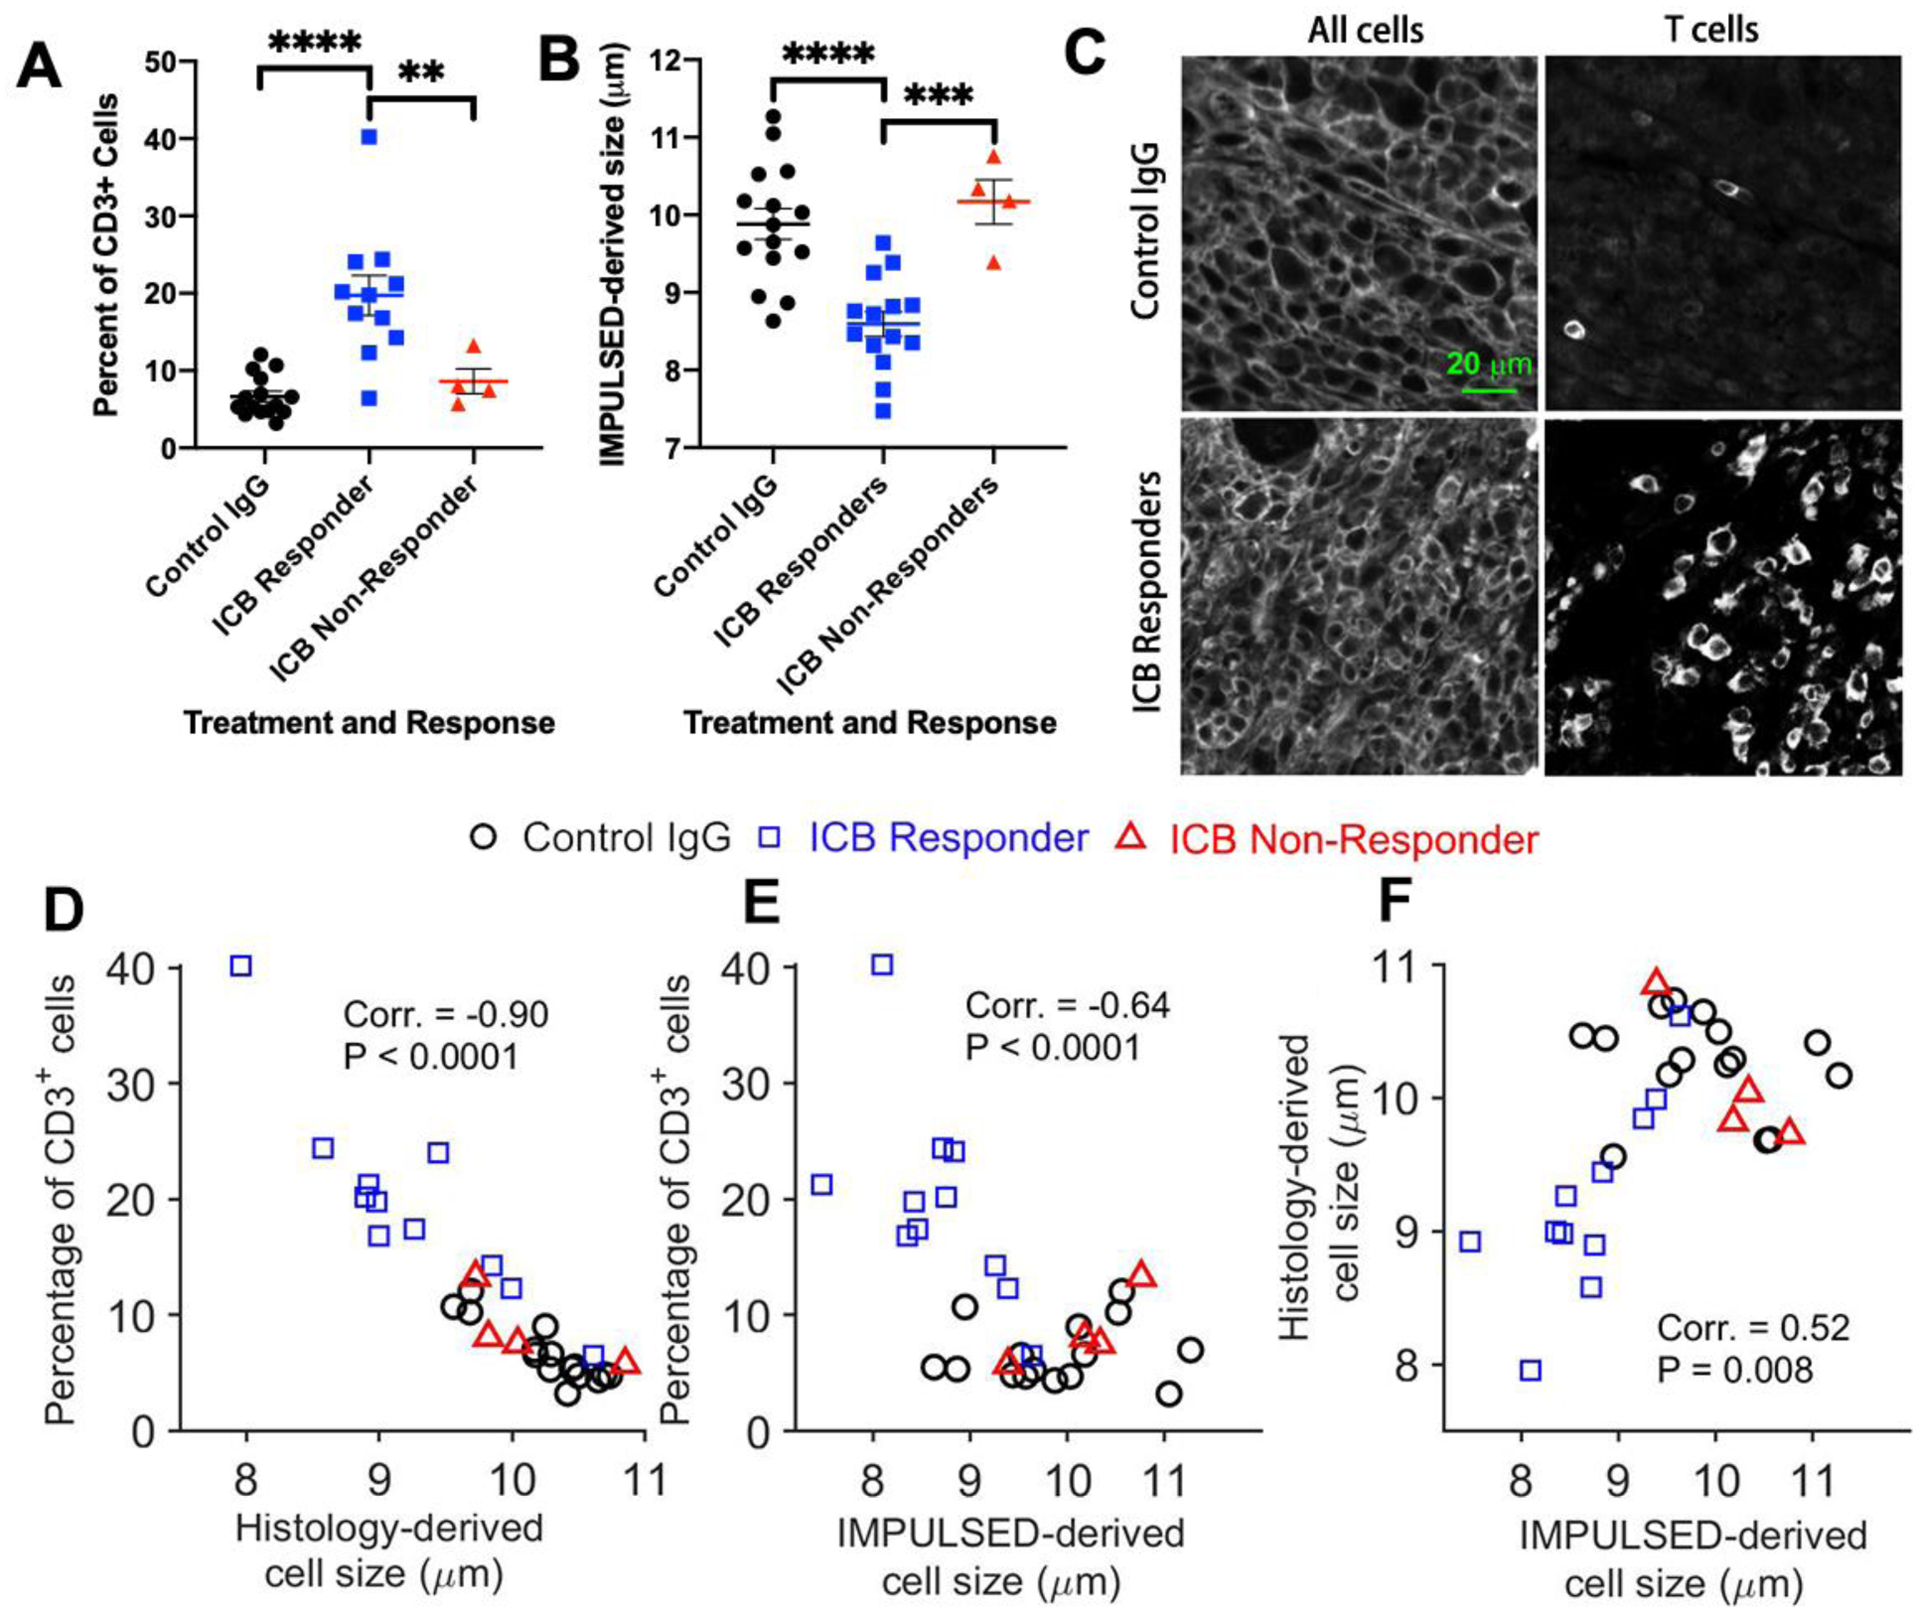
(A) Tumors from ICB responders had a significantly higher percent of CD3+ T cells as measured by immunohistochemistry compared to ICB non-responders and control IgG-treated mice; (B) ICB responding tumors had a significantly smaller mean cell size as measured by IMPULSE than tumors from control or ICB non-responders; (C). Examples of Immunohistochemical analyses of MC38 tumors treated with either control IgG (top) or checkpoint inhibitors (bottom); (D). Validation of IMPULSED-derived cell sizes using histology.