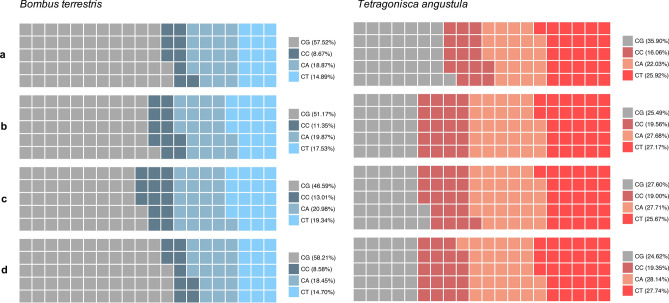
Figure 2.
Nucleotide context in which the methylated cytosines occur proportionally to all methylated cytosines reported in nurses of B. terrestris and T. angustula, in distinct gene sets. a in the entire transcriptome; b in the differentially expressed superTranscripts between foragers and nurses; c in the superTranscripts with higher expression levels in foragers; d in the superTranscripts with higher expression levels in nurses. Gray squares represent methylation at the CG context; methylation in non-CG context is illustrated in different shades of blue for B. terrestris and shades of red for T. angustula. One square ≈ 1%, and considering all of the mC reported sums up to 100%.

