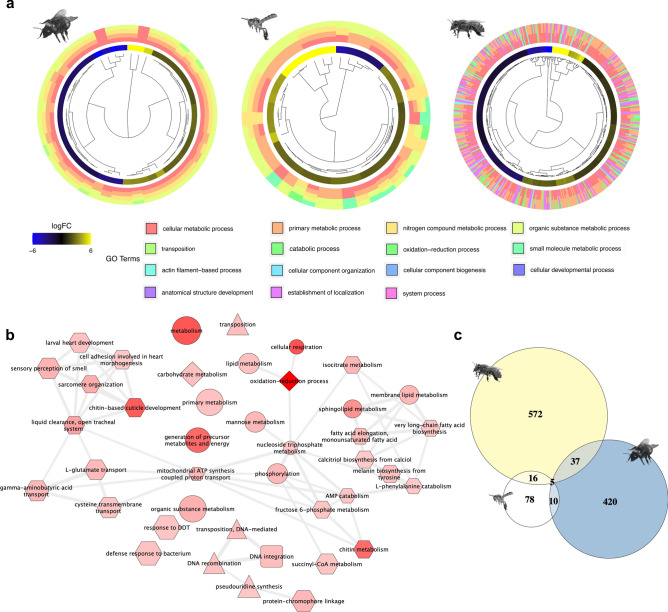
Figure 4.
Comparisons among B. terrestris, T. angustula and A. mellifera head GO processes involved in task specialization. a—Hierarchical clustering of the differentially expressed transcripts using the third hierarchical level of GO annotation organized by their mean logFC difference between nurses and foragers. Outer circle colors indicate which GO term the gene could be associated. b—Similarity network of the enriched GO terms in all species, after semantic similarity-based reduction. GO terms that are more similar to each other are linked, and the line width indicates the degree of similarity. Edge shape indicates whether the shown term is enriched in A. mellifera (hexagon), in B. terrestris (triangle), in T. angustula (circle), commonly enriched in B. terrestris and T. angustula (square), or commonly enriched in A. mellifera and T. angustula (diamond). Edge color intensity indicates the p value in the enrichment test (the darker the color tone, the smaller the p value). Edge size indicates the frequency of the GO term in the entire UniProt database. c—Euler diagram showing the number of genes in common between the set of differentially expressed genes of each species. A. mellifera by A. Wide, T. angustula by L. Costa—images reproduced with permission from the original authors.

