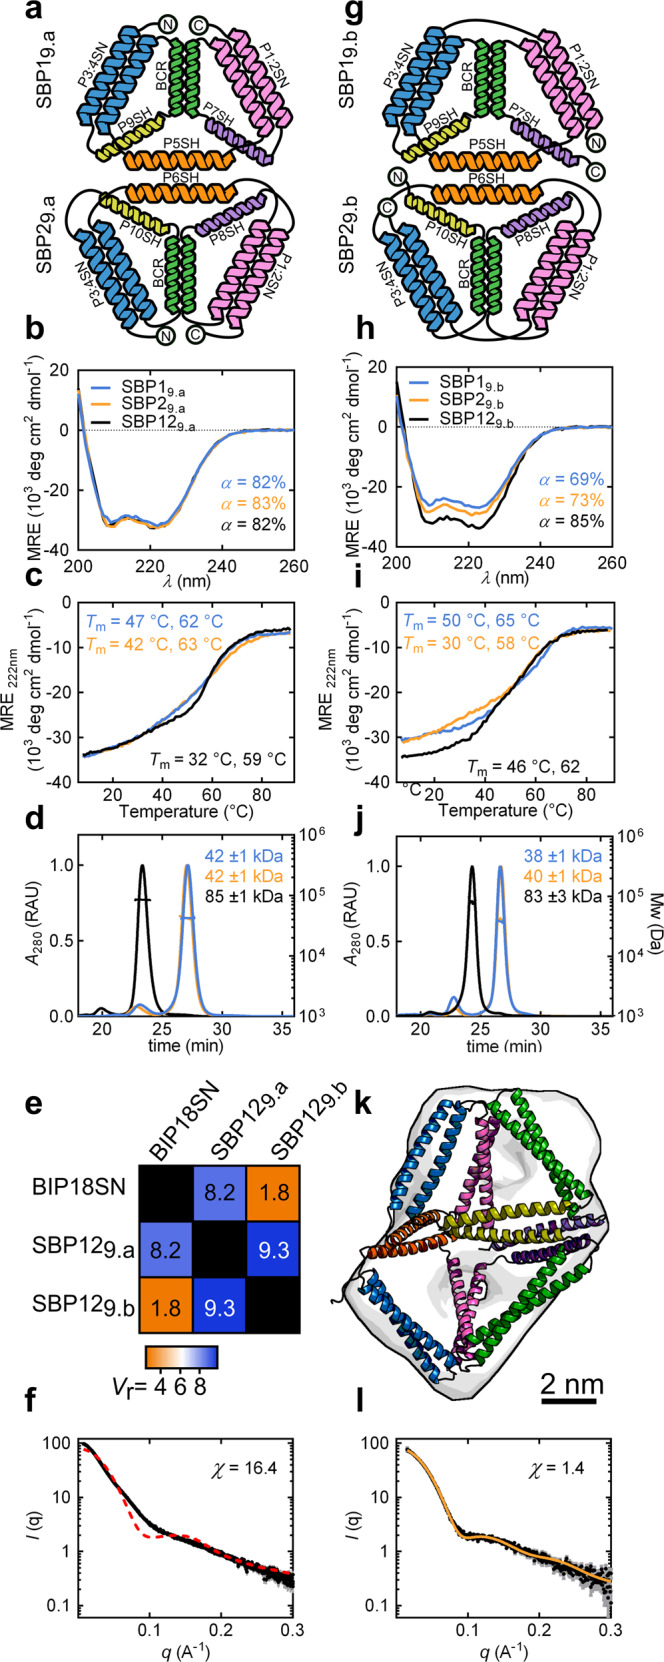
Fig. 3. Design and characterisation of the CCPO trigonal bipyramid cage from pseudo-symmetric pre-organised subunits.

a Topological schemes of SBP19.a and SBP29.a. Coiled-coil pairs are represented as coloured helices, N- and C-termini are indicated with circled letters. b CD spectra of the proteins SBP19.a and SBP29.a and the complex SBP129.a resulting from their interaction (cyan, orange and black, respectively) at 20 °C. c CD signal at 222 nm of the proteins SBP19.a and SBP29.a and the complex SBP129.a (cyan, orange and black, respectively) during thermal denaturation, the melting temperatures (Tm) are indicated in the panel. d SEC-MALS chromatograms and molecular masses for the proteins SBP19.a and SBP29.a and the complex SBP129.a. Theoretical Mw(SBP19.a) = 41.8 kDa and Mw(SBP29.a) = 41.7 kDa. UV signal is reported in relative absorbance units (RAU). e SAXS similarity matrix for BIP18SN, the complex SBP129.a and the complex SBP129.b. The similarity of conformations based on SASX results evaluated using the volatility ratio (Vr) metric. f Comparison of the experimental SAXS profile of the complex SBP129.a (black trace) with the theoretical scattering profile calculated for the BIP18SN model structure (dotted red trace) showing the difference from the single-chain protein BIP18SN. Error bars in grey represent the standard deviation for each data point in black (mean). g Topological schemes of SBP19.b and SBP29.b. CC pairs are represented as coloured helices. h CD spectra of the proteins SBP19.b and SBP29.b and the complex SBP129.b (cyan, orange and black, respectively) at 20 °C. i CD signal at 222 nm of the proteins SBP19.b and SBP29.b and the complex SBP129.b (cyan, orange and black, respectively) during thermal denaturation, the melting temperatures (Tm) are indicated in the panel. j SEC-MALS chromatograms and molecular masses for the proteins SBP19.b and SBP29.b and the complex SBP129.b. Theoretical Mw(SBP19.b) = 40.0 kDa, Mw(SBP29.b) = 39.7 kDa. UV signal is reported in relative absorbance units (RAU). k SAXS ab initio reconstruction superimposed on the molecular model of the SBP129.b complex displaying the best fit to the experimental data. l Experimental SAXS profile of the complex SBP129.b (black trace) matched well with the theoretical SAXS profile calculated for SBP129.b model structure (χ = 1.4) (orange trace). Error bars in grey represent the standard deviation for each data point in black (mean). Source data are provided as a Source Data file.
