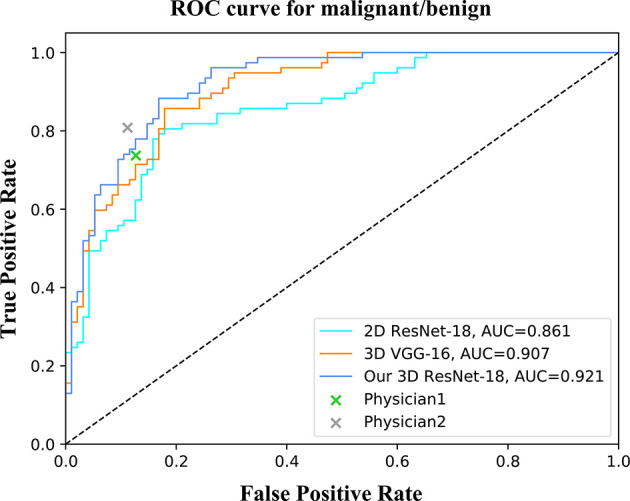
Figure 4.

ROC curves of different networks for binary classification. The performance of physicians in the observer study is also shown in the graph.

ROC curves of different networks for binary classification. The performance of physicians in the observer study is also shown in the graph.