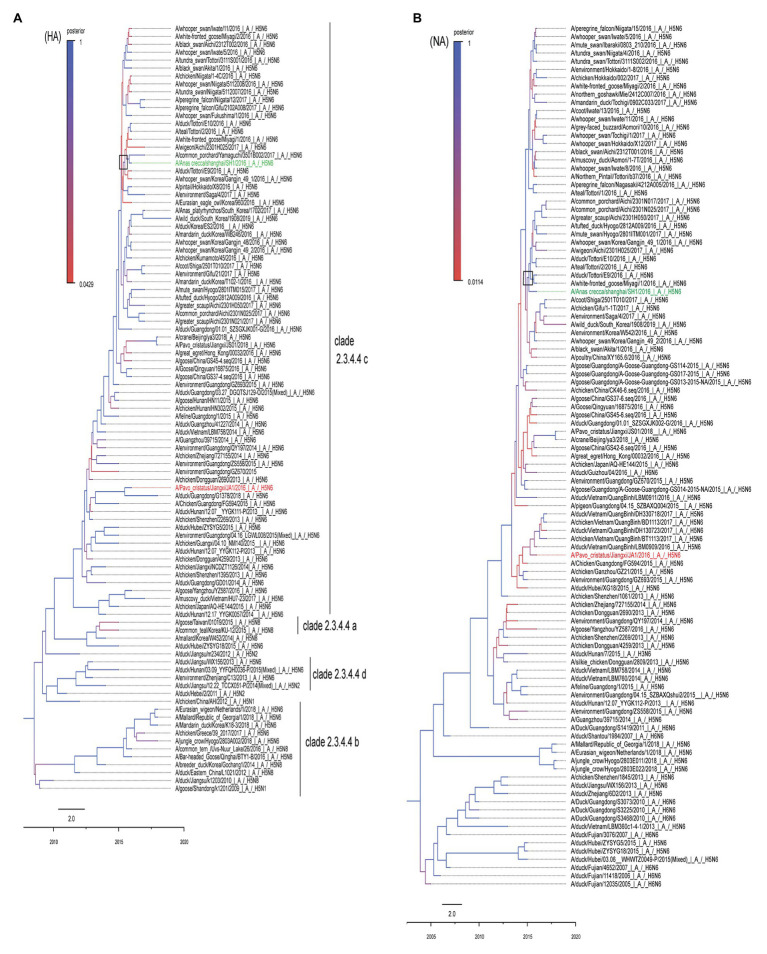
Figure 1.
MCC trees of HA and HA genes of SH1 and JA1 viruses. The phylogenetic analyses were conducted using the listed gene sequences, which were obtained from the GISAID and NCBI GenBank database. Panels (A,B) represent the MCC trees of HA and NA genes, respectively. SH1 is marked in green and JA1 is marked in red. The trees were built by BEAST software (V1.8.4) and illustrated by Fig Tree (v1.4.3). Time-scaled phylogenies (date-based axis shown at the bottom of the figure) were inferred using uncorrelated relaxed clock Bayesian Markov chain Monte Carlo (MCMC) analysis. HA, hemagglutinin and NA, neuraminidase.

