Figure 1.
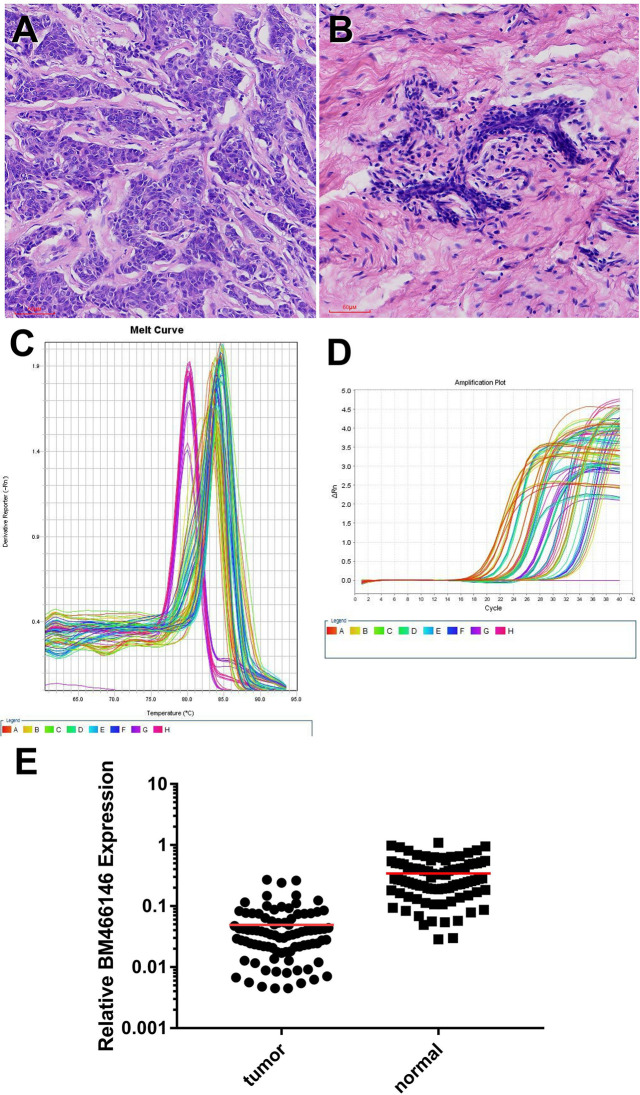
Expression of lncRNA BM466146 in breast cancer tissues and normal adjacent tissues (A, B) HE images of breast invasive carcinoma and normal breast tissues (HE×200). (C, D) RT-PCR results showed that the melting curves were all single peaks, no abnormal peaks, and no non-specific amplification. The four phases of the amplification curve at baseline phase, exponential growth phase, linear growth phase, and plateau phase are obvious. (E) The expression of lncRNA BM466146 is high in normal breast tissue and low in breast cancer tissue. The difference between the two is about 7.95 times (median change, U=385.000, P<0.001).

