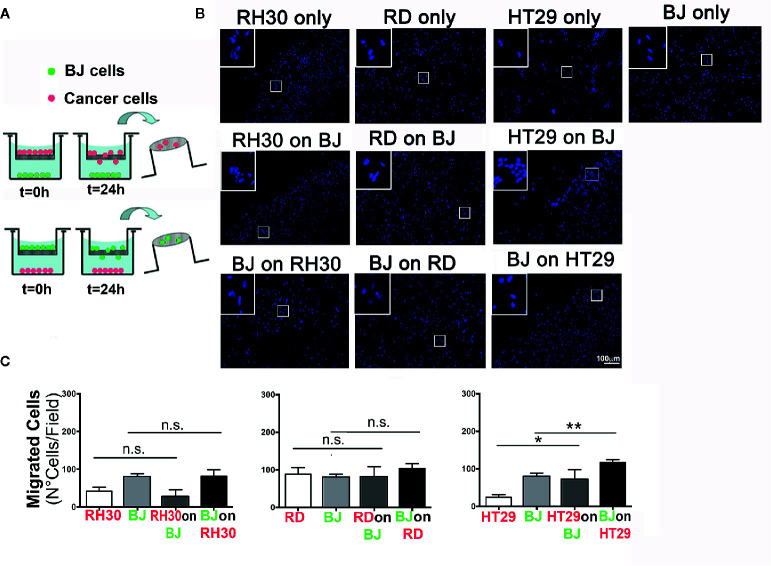
Figure 1.
Migration assay. (A) Schematic representation of the transwell procedure. Initial experimental conditions (T = 0 h) and data evaluation (T = 24 h) were depicted for RMS (RH30 and RD cells) and CRC (HT29) cells. (B) Representative images (10× magnification) of the migrated cells are shown. Insets indicate higher magnification (20×) of the cells that crossed through the porous membrane. DAPI (blue) marks cell nuclei. Scale bar = 100 µm. (C) Number of cells per field that passed through the membrane was determined for mono-culture (control RH30, RD, BJ, and HT29 only) or double cell combinations (“on,” x axis of the graph, indicates the cell line grown on top of transwell porous membrane; lower positioned cell line was grown inside the well plate); *p = 0.01, **p < 0.01; n.s., not significant.

