
Figure 4.
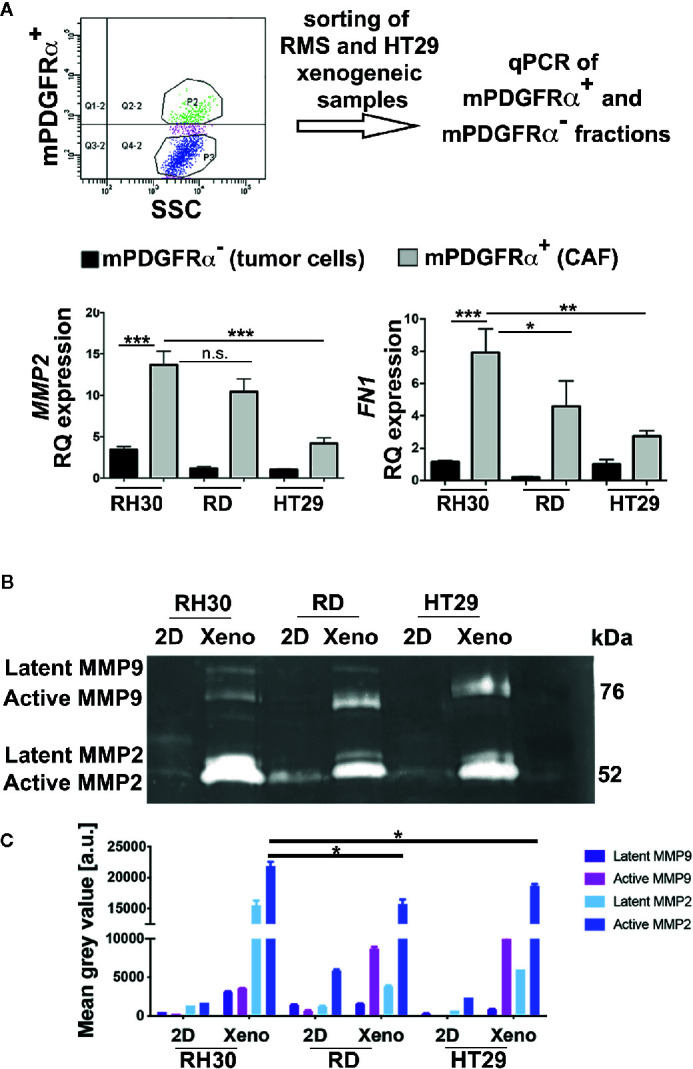
Analysis of mPDGFRα positive and negative fractions. (A) Upper row. The steps of the adopted experimental procedure are depicted. Lower row. Left. qPCR for MMP2 in xenogeneic tumors (3D) of epithelial (HT29) and mesenchymal (RMS: RH30, RD cell lines) origin. The small percentage of CAFs (mPDGFRα positive cells) isolated from RH30 and RD xenogeneic samples highly expressed the gene. Right. qPCR for FN1 in xenogeneic tumors (3D) of epithelial (HT29) and mesenchymal (RMS: RH30, RD cell lines) origin. The small percentage of CAFs (mPDGFRα positive cells) isolated from RH30 and RD xenogeneic samples highly expressed the gene. HT29 (mPDGFRα-, tumor cells) was used as calibrator. In the Figure p-value relative to two group comparison (i.e. HT29 versus RH30, HT29 versus RD) was reported (Mann-Whitney-test. *p < 0.05; ***p < 0.001; **p < 0.01). Kruskal-Wallis test was also performed (MMP2 p = 0.0067; FN1 p = 0.005). (B) Zymography in RH30, RD, HT29 cells grown in 2D and isolated from xenogeneic tumor masses developed in immunocompromised mice (3D). The cells cultured in 2D do not express active MMP9 and MMP2 enzymes while their 3D counterpart does (xenogeneic samples). (C) MMP9 and MMP2 quantification. Xenogeneic samples express higher level of the two enzymes in respect to 2D petri culture. In particular, active MMP2 is significative more expressed in RH30 xeno than HT29 xeno samples. n.s., not significant.