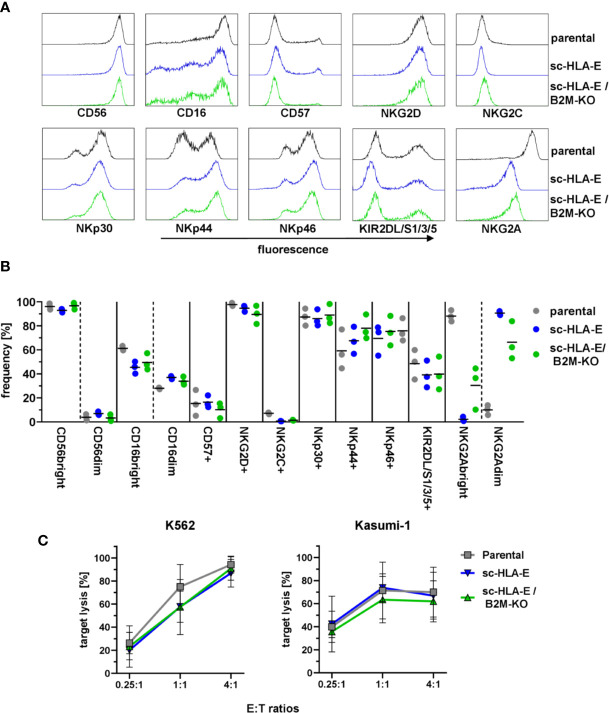
Figure 3.
Functional and phenotypical analysis of the gene modified NK cells. (A) Representative flow cytometry plots of the phenotypical analysis of the NK cell cultures. (B) Quantification of NK cell frequencies for phenotypic markers in parental, sc-HLA-E and sc-HLA-E/B2M-KO NK cell cultures from left to right for each marker (all data points shown, n = 3). (C) Quantification of natural NK cell cytotoxicity by lysis of the AML cell lines K562 and Kasumi-1 after co-incubation for 6 h. Statistical analysis was performed by two-way ANOVA with Holm-Sidak testing for multiple comparisons. No statistically significant differences could be detected (mean ± SD; K562: n = 6 for parental and sc-HLA-E/B2M-KO and n = 5 for sc-HLA-E NK cells; Kasumi: n = 4 for parental and sc-HLA-E/B2M-KO and n = 3 for sc-HLA-E NK cells).

