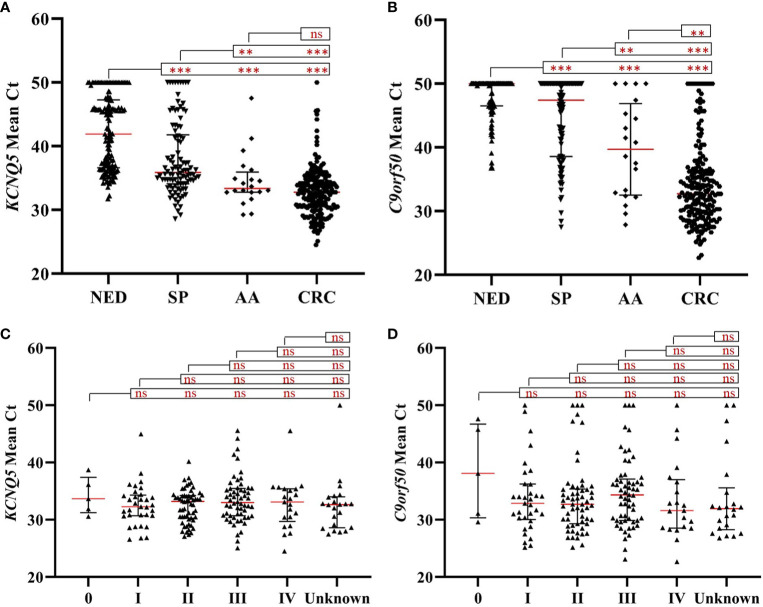
Figure 2.
The methylation levels of KCNQ5 and C9orf50 in no evidence of disease (NED), small polyp (SP), advanced adenoma (AA), colorectal cancer (CRC) groups (A, B) and different stages of CRC (C, D). **p < 0.01; ***p < 0.0001, ns, no significant difference according to Student’s t-test. Red lines represent the median methylation levels of KCNQ5 or C9orf50. Mann–Whitney U test compared to methylation levels of KCNQ5 and C9orf50 in NED, SP, AA, CRC groups.

