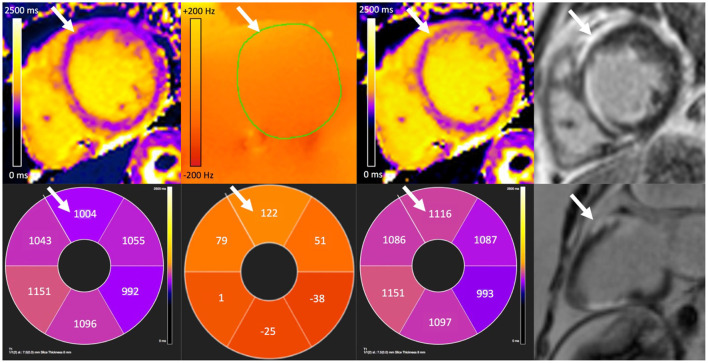
Figure 4.
A corrected T1 map revealing anterior wall scar (white arrows) in a patient with cardiac sarcoidosis and an implanted permanent pacemaker. There is false lowering of original T1 measurement (far left) in the anterior wall due to off-resonance (center-left). Off-resonance can be measured and then corrected for to generate an off-line T1 map (center-right). Bottom row shows corresponding average segmental T1 and off-resonance (Hz) values, and 2-chamber wideband late gadolinium enhancement (LGE). Elevated T1 after correction corresponds with distribution of scar seen on wideband LGE (far right) imaging.

