FIGURE 2.
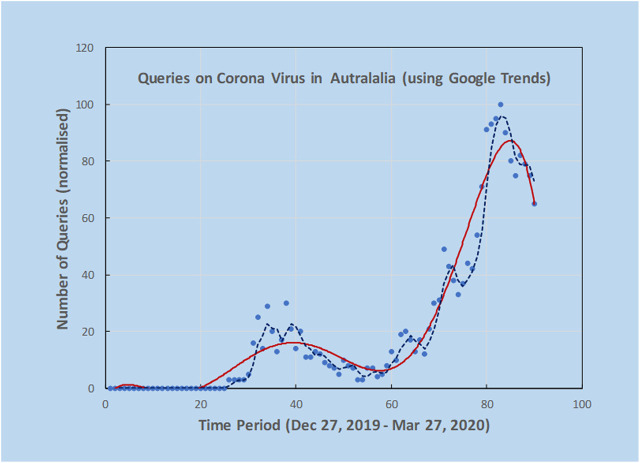
Using Google Trends, it was possible to investigate online search activity over a period of three months using the keywords “Corona Virus Australia”. Solid line is an estimate of trend by fitting a polynomial curve to the scatterplot data from Google Trends and the dashed line is 3-point moving average. Peaks indicate high interest at certain dates that could be correlated with news reports. Note the double peak in query dates.

