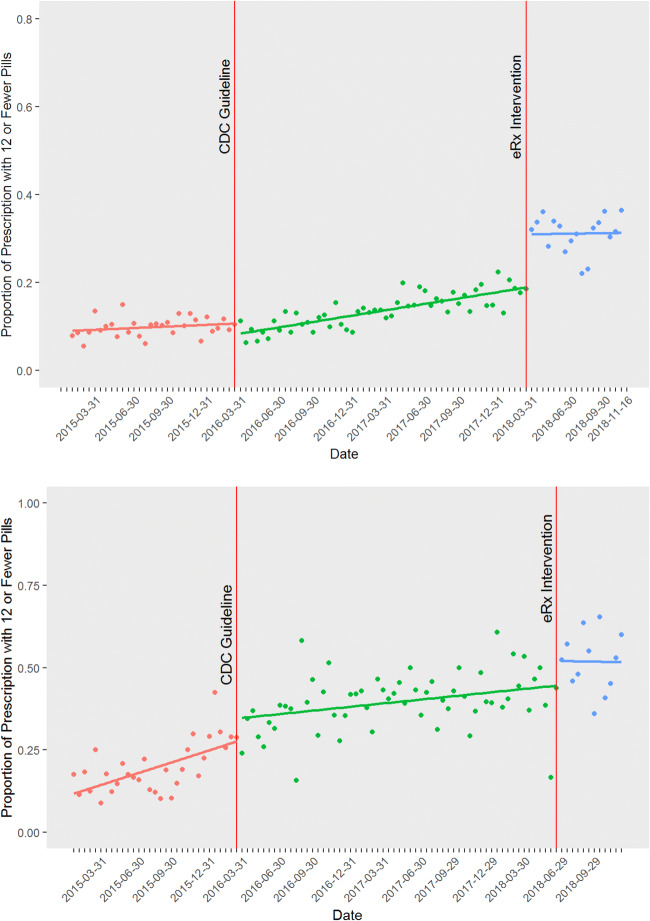
Figure 1.
Rates of guideline-concordant prescribing per 2-week interval at the academic medical center (top) and the FQHC (bottom). The vertical red line in March 2016 indicates the publication of the CDC Guideline, treated as interruption 1 in the interrupted time series models. The vertical red line in March 2018 (the academic medical center) and June 2018 (the FQHC) indicates the default intervention, treated as interruption 2 in the models. Superimposed trend lines were constructed using segmented regression. Note that for the FQHC, the small increase at the time of the eRx intervention was found to be non-significant.

