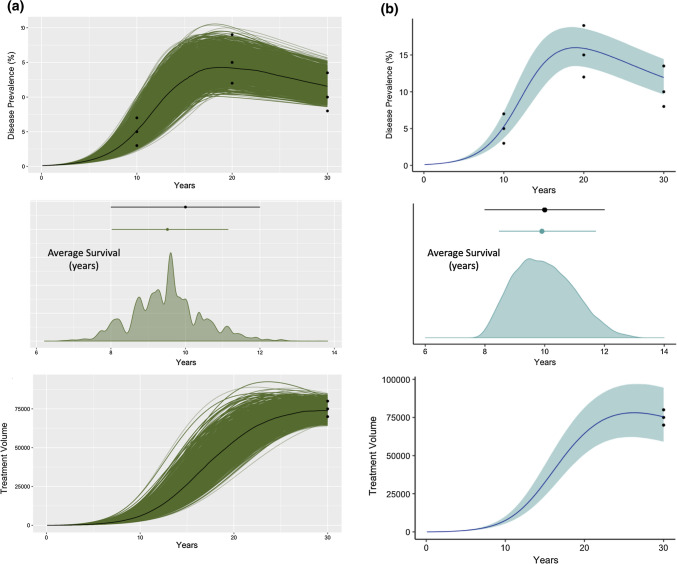
Figure 6.
Example 3—disease transmission: SIR and CaliPro calibrations. (a) We recreated the results of Menzies et al.38 by using SIR to calibrate the ODE transmission model (individual model simulations shown as green lines and median trend line shown in black) to three experimental outcomes: disease prevalence, average survival (in years), and treatment volume. The average survival graph also shows the posterior distribution of average survival across all the parameter combinations. Experimental data are shown as black data points. (b) Model simulation and experimental outcomes following CaliPro using HDR. The 5th–95th percentile is represented by the blue region (50th percentile—dark blue line). Termination criteria: 75% of runs must belong to pass run set. Pass set definition: (iterations 1–3) For each time point, simulation values lie within 1.25 times the maximum experimental data point and 0.75 times the value of the minimum experimental data point for all calibration targets. (Iteration 4) Changed the lower bound of pass set definition to be an exact match to the experimental data at each timepoint.

