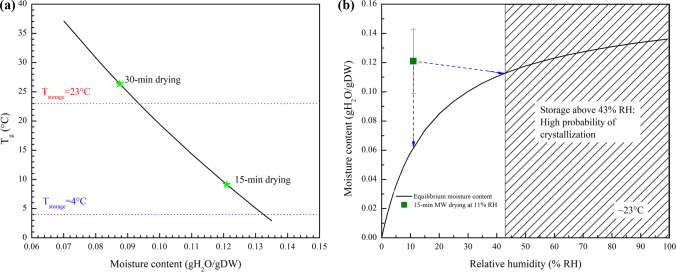
Figure 4.
(a) Tg values at different moisture contents were predicted by the Gordon–Taylor equation. The Tg values (green stars) produced by drying for 15 min and 30 min were higher than general cold storage temperature (4 °C, blue dotted line) and room temperature (23 °C, red dotted line), respectively. (b) Moisture content data from samples processed by microwave for 15 min (green square) are overlaid on the fitting curve (black line) obtained by the GAB model. The dotted lines (blue) represent the possible change in equilibrated moisture content during storage at 11 and 43% RH.

