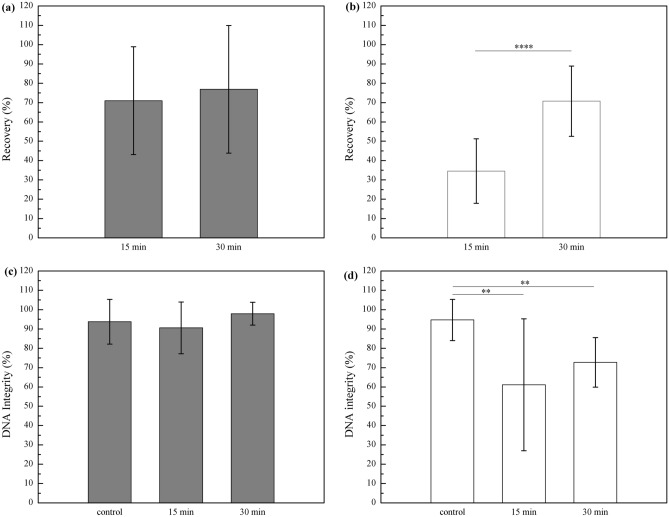
Figure 6.
Percentage of recovered oocytes relative to the total number of treated oocytes after microwave-assisted drying (a) and after 8-week storage in 11% RH air at ambient temperatures (b) and percentage of oocytes with intact DNA relative to the total number of recovered oocytes after microwave-assisted drying (c) and after 8-week storage in 11% RH at ambient temperatures (d). Data was expressed as mean ± standard deviation (SD). One-way and Kruskal–Wallis ANOVA was used for statistical analysis, **p < 0.01, ****p < 0.0001.

