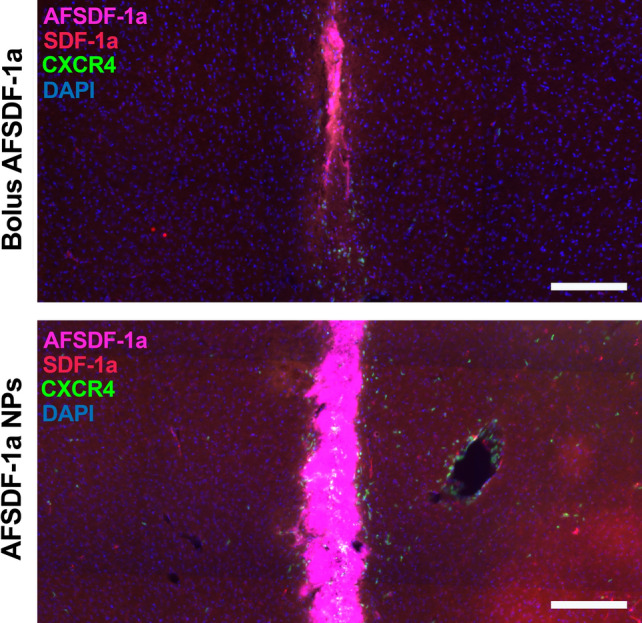
Figure 1.

Spatial distribution of total SDF-1a 1 day after exogenous delivery. Representative cortical tissue sections from bolus delivered AFSDF-1a (top) and AFSDF-1a loaded NPs (bottom) stained for cell nuclei (DAPI, blue) and total SDF-1a (red), with EGFP-CXCR4 (green) and exogenous AFSDF-1a (pink). Increased levels of total SDF-1a immunostaining and CXCR4 are present visually across the cortex for the NP group. Immunostaining reveals steady levels of total SDF-1a across the cortex for the NP group in contrast to the spatially decreasing pattern for the bolus group. Consistent spatial levels of total SDF-1a suggest autocrine/paracrine signaling is occurring. Figure is adapted from Dutta et al. with copyright permissions.7 Scale bar = 200 μm.
