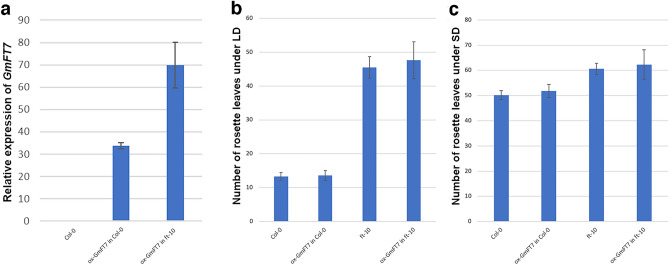
Figure 7.
Analysis of transgenic Arabidopsis plants—flowering time and qPCR analysis. (a) Relative expression of ox-GmFT7 in WT Arabidopsis and ft-10 mutant background. Five independent plants for each of Col-0, ox-GmFT7 in Col-0 and ox-GmFT7 in ft-10 were used for qPCR analysis along with two technical replicates. (b) Rosette leaves at bolting under LD conditions. (c) Rosette leaves at bolting under SD conditions. Error bars indicate standard deviation. Ten independent transgenic lines (5 plants from each independent line) were used for analysing transgenic plants, while 12 Arabidopsis plants were used as control (12 Col-0 plants and 12 ft-10 mutant plants). AT4G3427054 was used as a reference gene. Relative gene expression was calculated using 2−ΔΔCT method55. Results were shown as mean with standard deviation.

