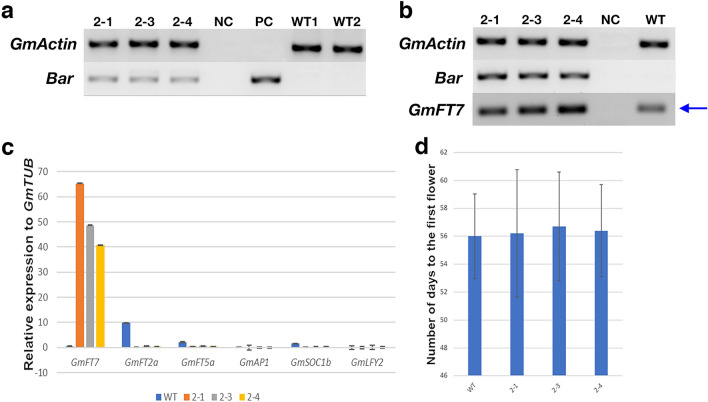
Figure 8.
Analysis of transgenic soybean plants. (a,b) Transgenic soybean cv. Bragg plants over-expressing GmFT7 analysis by genomic PCR showing the presence of the Bar gene (a) and RT-PCR confirmed the expression of both bar and GmFT7 transcripts (b). Soybean reference gene GmActin, herbicide resistance Bar gene, and GmFT7 CDS region were used for amplification. Trifoliate leaf from three T2 soybean transgenic lines; 2-1, 2-3 and 2-4 (21st day after sowing) was collected and used for genomic DNA and total RNA extractions. WT1, WT2 and WT, wild type soybean plants. NC, negative control (water was used as the template for PCR). PC, plasmid control (35S:GmFT7:polyA cassette in vector pUQC10255) as a positive control. (c,d) Flowering time and qPCR analysis. (c) qPCR analysis of GmFT7 and other flowering related genes—GmFT2a, GmFT5a, GmSOC1b, GmLFY2 and GmAP1 in transgenic and wild-type soybean plants. Total RNA isolated from trifoliate leaves and shoot apex from plants (21st day after sowing) were used, Experiment had two biological replicates (pool of tissues from three plants were counted as one biological replicate) and two technical replicates. GmTUB was used as reference genes for soybean plants. Relative gene expression was calculated using 2−ΔΔCT method55. Results were shown as mean with standard deviation from three replicates. (d) The number of days from sowing to first flower appearance in soybean. Three T2 lines (eight plants per line) were used for counting the number of days to first flower appearance.

