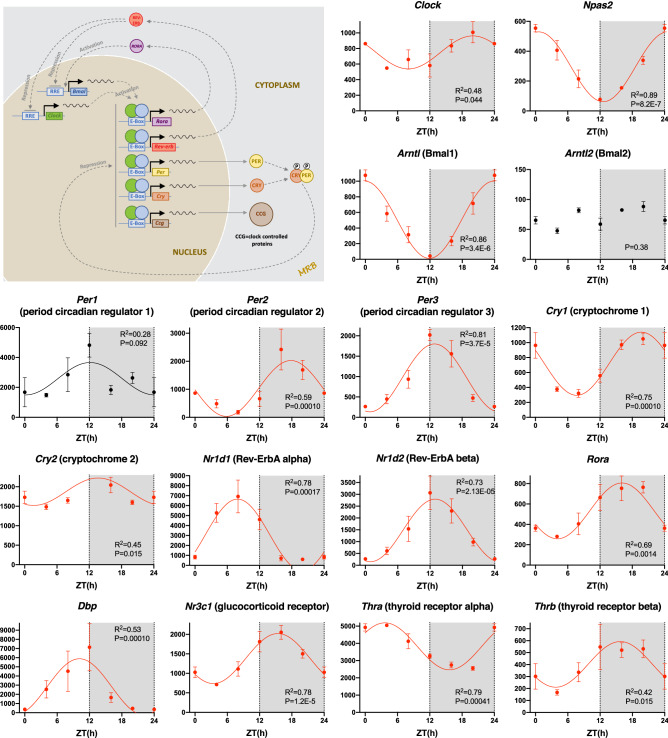
Figure 1.
Circadian clock. Abundance (normalised counts) of circadian clock transcripts and some potentially related transcripts is shown over 24 h. The inset shows a schematic diagram of the circadian clock. In this and similar figures: gene name and common name (in parenthesis) given; mean ± SEM transcript abundance shown (n = 3) at six ZT time points over 24 h (24 h data repeat of 0 h data); the permutation-based P value (corrected for multiple testing) from JTK Cycle for significance of a day-night rhythm is given; significant transcripts (permutation-based P value < 0.05) are shown in red and have been fitted with a sine wave by a least squares fitting method and the R2 value given; transcripts showing a trend towards significance (permutation-based P value > 0.05 and < 0.1) are shown in black and have again been fitted with a sine wave by a least squares fitting method and the R2 value given; non-significant transcripts (permutation-based P value > 0.1) are shown in black and have not been fitted with a sine wave.

