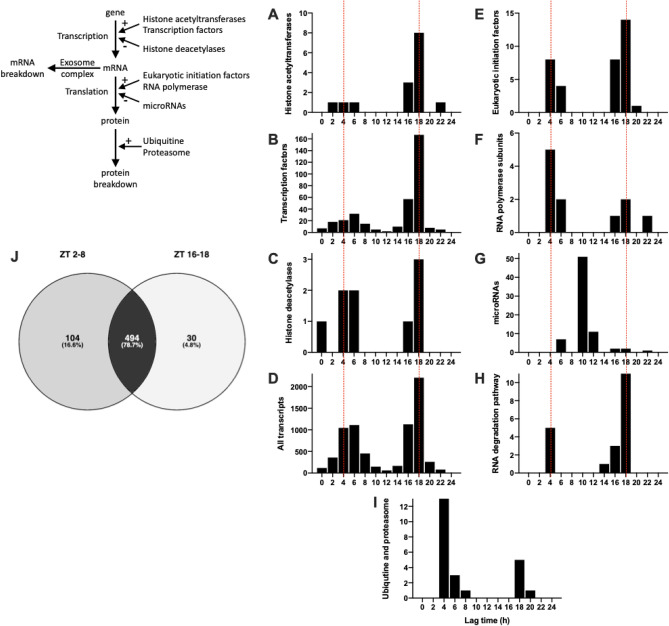
Figure 7.
Transcription, translation, and mRNA transcript and protein breakdown. (A–I), histogram of lag times (times of peak transcript abundance) of different groups of transcripts involved in transcription, translation, and mRNA transcript and protein breakdown. (J), Venn diagram of pathways involving the transcripts peaking during the day and night; data were analysed through the use of IPA (QIAGEN Inc., https://www.qiagenbioinformatics.com/products/ingenuitypathway-analysis)103. Inset, schematic diagram of the cycle of transcription, translation, and RNA and protein degradation.

