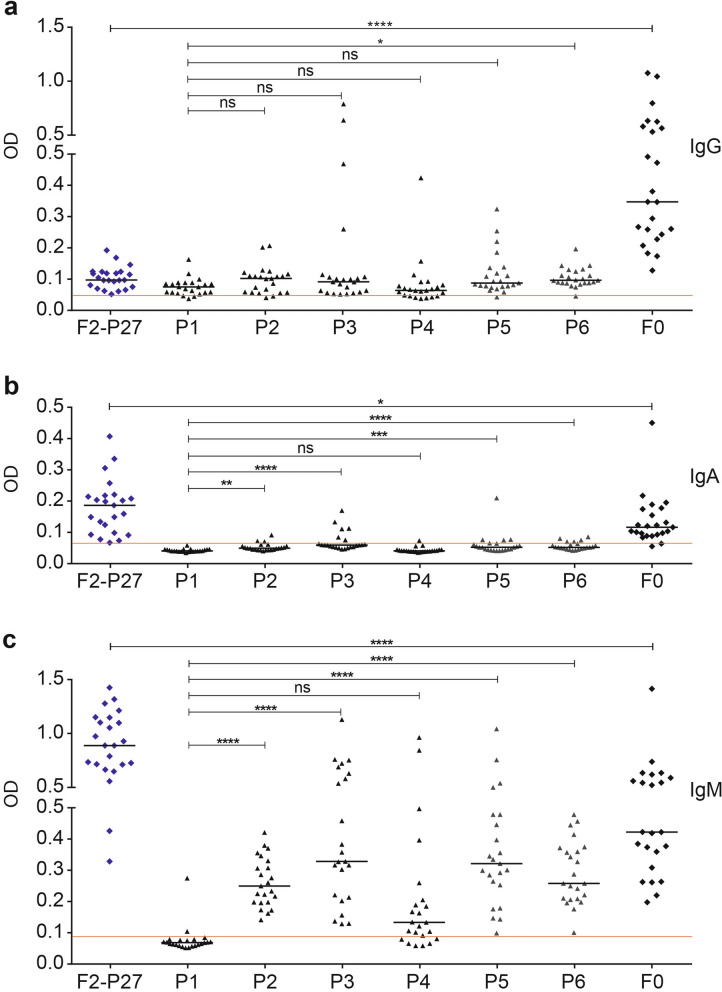
Figure 6.
Human antibody responses to recombinant F2-P27, F0 and F2-derived synthetic peptides. Shown are IgG (a), IgA (b) and IgM (c) levels (y-axis: optical density values) in sera from 23 adult individuals to recombinant F2-P27, F0 and F2-derived synthetic peptides (P1–P6), (x-axis). Horizontal lines within scatter plots indicate median values. The cut-off (mean of buffer control plus three times standard deviation) is indicated by a red line. Significant differences of antibody responses are indicated: ns (not significant); *p < 0.05; **p < 0.001; ***p < 0.0001.

