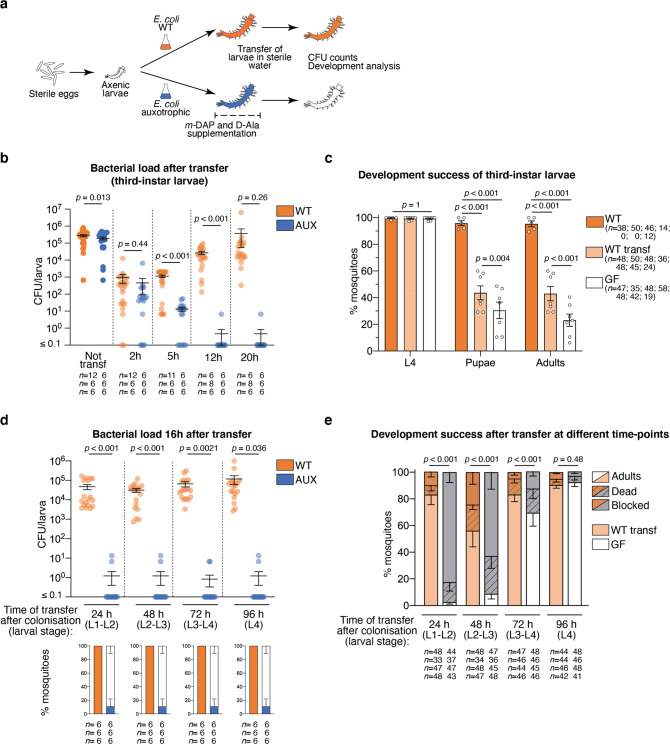
Fig. 3. Decolonisation dynamics and developmental analysis of germ-free larvae obtained via reversible colonisation.
a Schematic representation of the experimental setup. To stop bacterial colonisation, larvae are transferred to a sterile rearing water lacking meso-diaminopimelic acid (m-DAP) and D-alanine (D-Ala). Bacterial loads are measured via colony forming units (CFU) count at different time-points and the development success of transferred larvae is assessed. b Bacterial loads of third-instar larvae gnotobiotic for wild-type (WT, orange) or auxotrophic (AUX, blue) E. coli after 2, 5, 12 and 20 h from transferring into sterile rearing water. c Development success of larvae continuously colonised (WT, orange), reared on wild-type (WT transf, light orange) or auxotrophic (GF, white) E. coli until the third instar and transferred into sterile rearing water. The proportion of individuals reaching the fourth instar (L4), the pupal stage and adulthood is shown. d Bacterial loads of larvae gnotobiotic for wild-type (WT, orange) or auxotrophic (AUX, blue) E. coli transferred into sterile rearing water at different developmental stages (L1: first instar, L2: second instar, L3: third instar, L4: fourth instar). CFU counts were measured 16 h after transfer. e Proportion of individuals reaching adulthood (full bar), dying (striped dark bars) and with stalled development (dark bars) after being reared with wild-type (WT transf, light orange) or auxotrophic (GF, white) E. coli and being transferred into sterile rearing water after 24, 48, 72 or 96 h since colonisation. In (b–e), data show mean ± SEM of three (b, d), five (c, WT), seven (c, WT transferred and GF) or four (e) independent replicates. The exact number of individuals analysed per condition and replicate is indicated in each panel. Statistical significance was determined with generalised linear mixed models and least square means with Bonferroni correction. Exact p values are indicated in the figure. See Table S1 for detailed statistical information. Source Data are provided as a Source Data file.

