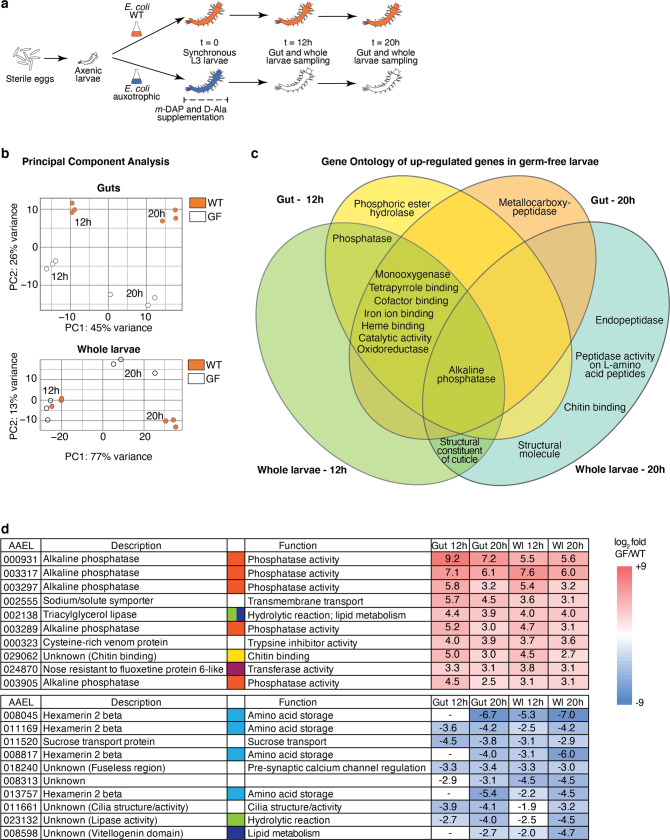
Fig. 5. Transcriptomic analysis of germ-free and colonised larvae.
a Schematic representation of the experimental setup. To produce third-instar germ-free larvae, larvae gnotobiotic for auxotrophic E. coli were transferred to a rearing medium lacking meso-diaminopimelic acid (m-DAP) and D-alanine (D-Ala). Midguts (n = 60/replicate) and whole larvae (n = 60/replicate) were sampled for RNA extraction 12 and 20 h after transfer, using wild-type E. coli gnotobiotic larvae as a control. Three independent replicates were performed. b Principal component analysis (PCA) of guts and whole larvae transcriptomic data of wild-type E. coli-carrying (WT, orange) and germ-free larvae (GF, white). c Venn diagram of Gene Ontology terms enriched for genes up-regulated in germ-free conditions. d log2-fold values and function of the ten highest up-regulated (red) and down-regulated (blue) genes in germ-free larvae, ordered by decreasing (up-regulated) or increasing (down-regulated) mean value in gut and whole larvae (Wl) sample (taking into account values with a padj < 0.001). Significant expression values (padj < 0.001) are coloured with a blue/red colour code corresponding to down/up-regulation. Hyphens mean absence from the DESeq2 output of genes with padj < 0.1, meaning that transcripts are either not detected or not differentially regulated at this 0.1 threshold. To improve visibility, different colour codes indicate genes with a shared function (orange: phosphatase activity; green: hydrolytic reaction; yellow: chitin binding; purple: transferase activity; light blue: amino-acid storage; dark blue: lipid metabolism). Source Data are provided as a Source Data file.

