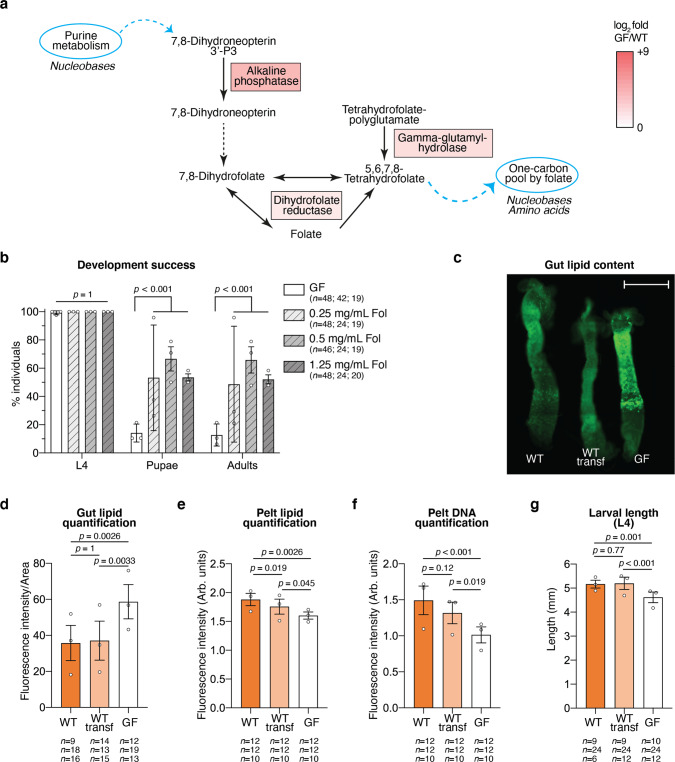
Fig. 6. Investigation of folate supplementation and lipid metabolism in germ-free larvae.
a Representation of the mosquito gene products that participate in the folate biosynthesis pathway and that were up-regulated in germ-free larvae. Enzymes responsible for reactions between 7,8-Dihydroneopterin and 7,8-Dihydrofolate are not encoded by the Ae. aegypti genome (black dotted line). The up-regulation colour code is the same as in Fig. 5d and reflects the mean of log2 fold in the four sample types. Light blue circles represent metabolic pathways connected to folate biosynthesis through the indicated molecular products. Molecule types indicated below are involved in those pathways. b Proportion of larvae reaching the fourth instar (L4), the pupal stage and adulthood in germ-free conditions (GF, white) or in germ-free conditions with folic acid (Fol) supplementation at different concentrations (light grey: 0.25 mg/mL folic acid; mid grey: 0.5 mg/mL folic acid; dark grey: 1.25 mg/mL folic acid). c Exemplifying image of three guts belonging to fourth-instar larvae gnotobiotic for E. coli wild-type before (WT) and after the transferring to new rearing medium (WT transf) and germ-free (GF) stained with BODIPY 505/515. Scale bar: 1 mm. This image is representative of data from three independent replicates (see (d) for overall data and number of guts/replicate). d, e Quantification of BODIPY 505/515 fluorescence intensity in the gut (d, normalised to the gut area) and pelt (e, Arb. units – arbitrary units) of fourth-instar larvae gnotobiotic for E. coli wild-type before (WT, orange) and after the transferring to new rearing medium (WT transf, light orange) and germ-free (GF, white). f Quantification of DAPI fluorescence intensity in the pelt of fourth-instar larvae in the three gnotobiotic conditions. g Larval length measured at the second day of the fourth instar. In (b, d–g), data represent the mean ± SEM of three independent replicates. The exact number of individuals analysed per condition and replicate is indicated in each panel. Statistical significance was determined with generalised linear mixed models and least square means with Bonferroni correction. Exact p values are indicated in the figure. See Table S1 for detailed statistical information. Source Data are provided as a Source Data file.

