Fig. 4.
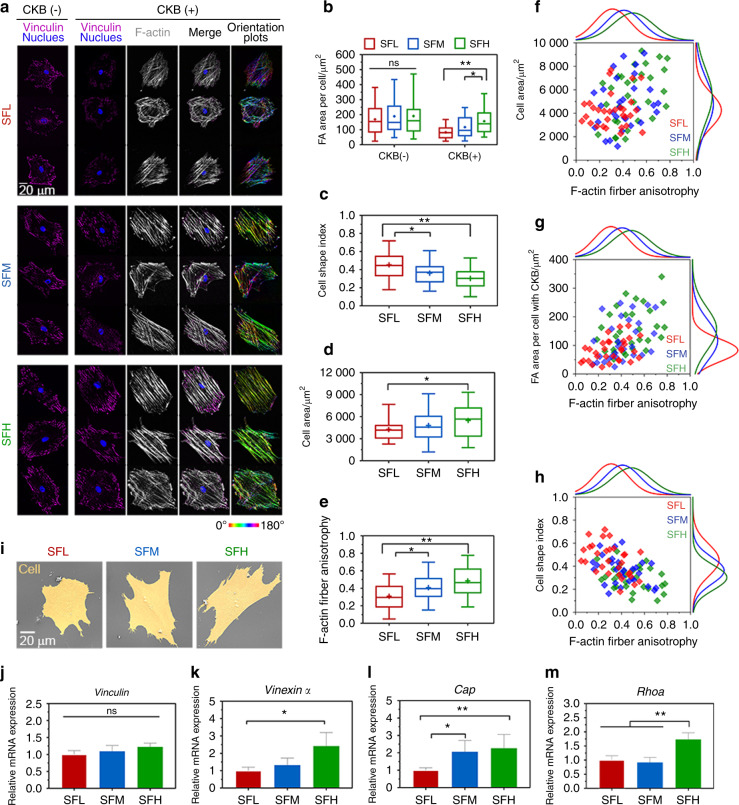
Spreading behavior of BMSCs on different SF substrates. a Representative mosaic immunofluorescence images of vinculin (purple), F-actin (white), and nuclei (blue) in BMSCs without and with CKB treatment and the corresponding orientation plots for F-actin staining, where the different colors indicate different orientations of actin filaments as per the given color map. b–e Quantitative analysis of (b) FA area per cell, (c) cell shape index, (d) cell area, and (e) F-actin anisotropy in BMSCs. f–h Single-cell scatter plots of F-actin anisotropy as a function of (f) cell area, (g) FA area per cell, and (h) cell shape index. i SEM images of BMSCs’ spreading morphology. j–m The mRNA expression levels of (j) Vinculin, (k) Vinexin α, (l) Cap, and (m) Rhoa in BMSCs. For each box plot, the box boundaries represent the 25th–75th percentiles, and the whiskers represent the min and max values. The central line and cross represent the median value and mean, respectively. Error bars represent one standard deviation. (*P < 0.05 and **P < 0.01)

