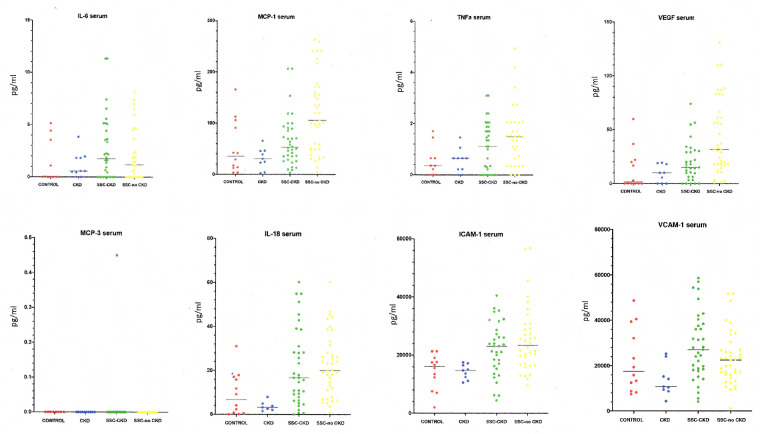
Fig. 1.
Candidate markers in SSc-associated chronic kidney disease and controls: serum analysis
The panels show the distribution for each analyte in serum for the controls and for patients with SSc with chronic kidney disease (CKD) and those without CKD. The panels also show values for the non-SSc cohort with CKD. Significant differences by ANOVA and pairwise comparison are detailed in the main text and in Table 2.

