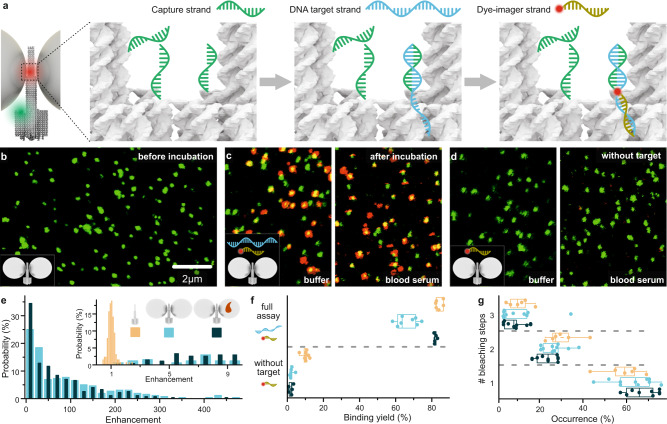
Fig. 2. Single-molecule diagnostic assay with NACHOS.
a Sketch of NACHOS with three capture strands in the hotspot and a green reference dye (ATTO 542) for labeling of the DNA origami. Capture strands are placed in the NACHOS hotspot region. Upon incubation, they hybridize with DNA target strands specific to Klebsiella pneumonia, exposing a specific, 17-nt long region for the hybridization with the imager strand labeled with Alexa Fluor 647. b Confocal fluorescence image of the NACHOS before incubation with DNA target and imager strands. c Confocal fluorescence images after incubation with DNA target (2 nM) and imager strands (6 nM) in buffer solution (left) and blood serum (right), scale same as in panel b; d Confocal fluorescence image of the NACHOS after incubation with only the DNA imager strand (6 nM) in buffer solution (left) and blood serum (right), scale same as in panel b. The scans in panels b-d are representative for at least 20 images. e Fluorescence enhancement histogram of the sandwich assay in NACHOS measured in buffer solution (light blue) as well as in blood serum (dark blue). The inset includes a zoom in into the enhancement histogram overlaid with an enhancement histogram obtained for non-enhanced single Alexa Fluor 647 dyes (orange). Between 127 and 273 NACHOS and reference structures were analyzed in buffer solution and blood serum, respectively. f Binding yield obtained for the full sandwich assay (2 nM target and 6 nM imager strands) and for the control experiment (imager strand only) without nanoparticles (orange) as well as with nanoparticles in buffer solution (light blue) and in blood serum (dark blue). At least 546 spots were analyzed out of at least 5 different areas for each sample. Alexa Fluor 647 was excited at 639 nm and ATTO 542 at 532 nm. g Distribution of fluorescence bleaching steps observed in fluorescence transients for NACHOS in buffer solution and in blood serum and reference structures. Over 240 structures from at least 6 different areas per sample were analyzed. The box plots in panels f and g show the 25/75 percentiles and the whisker represents the 1.5*IQR (inter quartile range) length, the center lines represent the average values.

