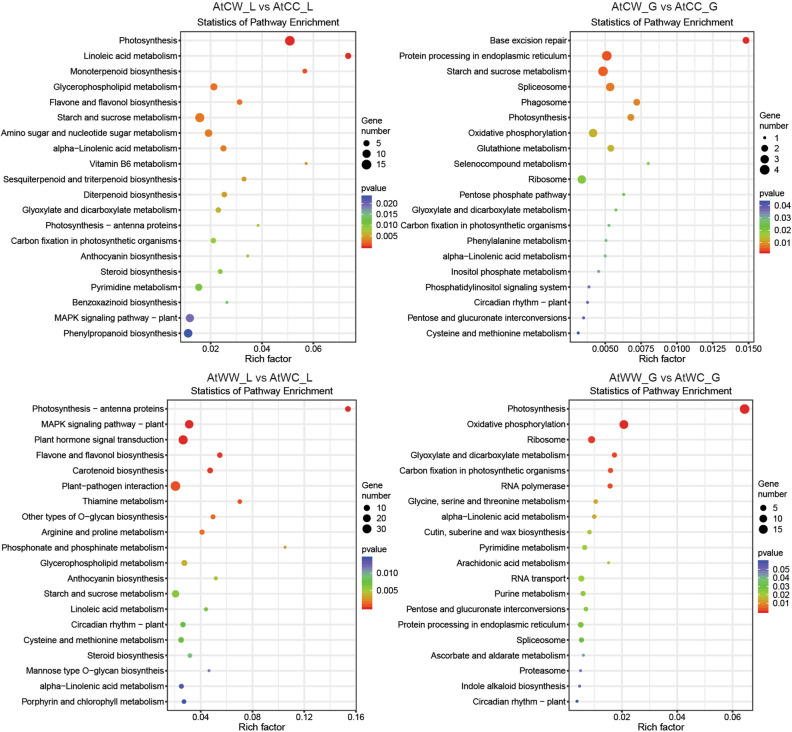
Figure 2.
KEGG pathway enrichment analysis of stress-responsive genes in the progeny from the control parents and water-deficit stressed parents. The treatment groups are: AtCC (DBA Artemis control group parents, progeny treated with control), AtCW (DBA Artemis control group parents, progeny treated with water-deficit stress), AtWC (DBA Artemis water-deficit stress group parents, progeny treated with control), AtWW (DBA Artemis water-deficit stress group parents, progeny treated with water-deficit stress). _L represents flag leaf libraries, _G represents developing grain libraries. The rich factor represents the degree of enrichment, calculated based on the proportion of stress-responsive genes within all the genes under a specific KEGG pathway.

