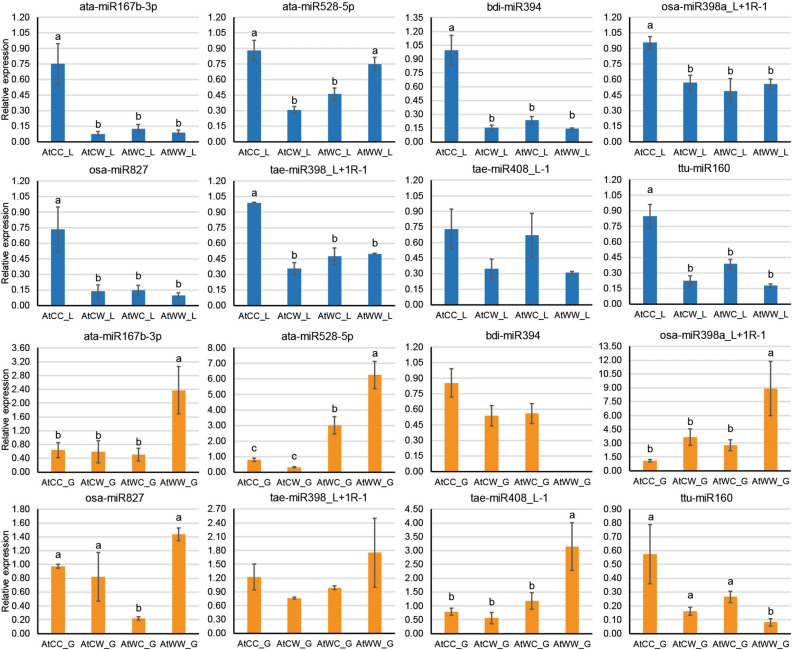
Figure 4.
qPCR analysis of eight stress-responsive miRNAs in the flag leaf tissue (denoted with _L, highlighted in blue) and in the developing grains (denoted with _G, highlighted in orange) of DBA Artemis. Relative miRNA expression was calculated using GAPDH as the housekeeping gene. Data are presented as the mean ± standard error (SE) (n = 3). One-way ANOVA was used to determine statistical significance across treatment groups at P < 0.05 with the l.s.d. value (least significant difference). Different letters (a–c) denote the statistical difference across the treatment groups. The treatment groups are: AtCC (DBA Artemis control group parents, progeny treated with control), AtCW (DBA Artemis control group parents, progeny treated with water-deficit stress), AtWC (DBA Artemis water-deficit stress group parents, progeny treated with control), AtWW (DBA Artemis water-deficit stress group parents, progeny treated with water-deficit stress).

