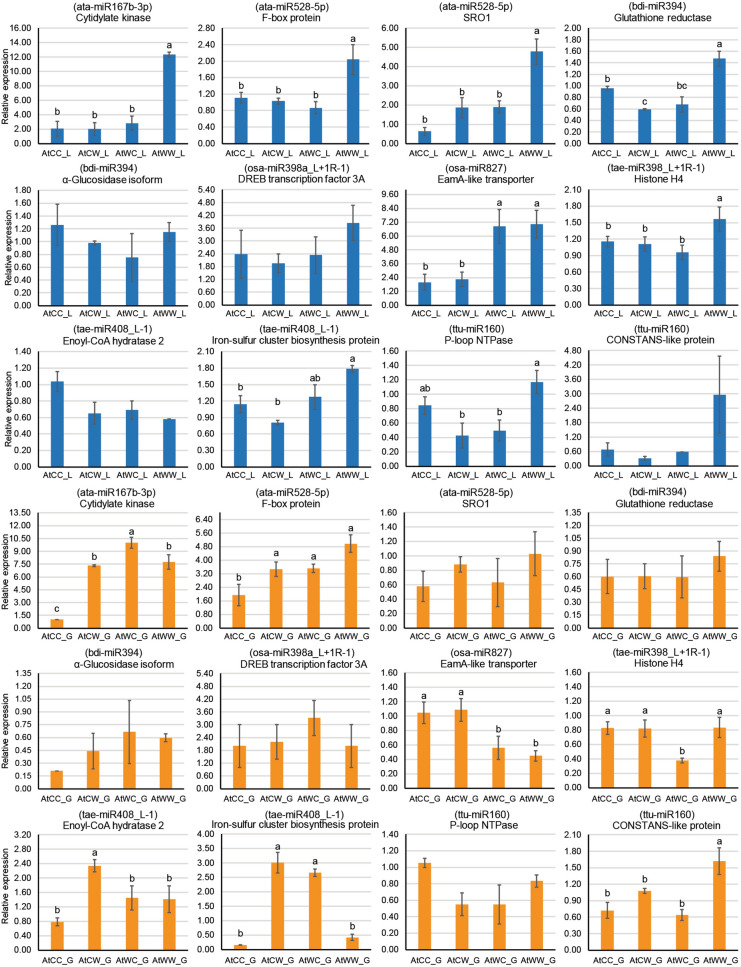
Figure 5.
qPCR analysis of 12 stress-responsive target genes in the flag leaf tissue (denoted with _L, highlighted in blue) and in the developing grains (denoted with _G, highlighted in orange) of DBA Artemis. The miRNA targeting the gene is shown in brackets. Relative gene expression was calculated using GAPDH as the housekeeping gene. Data are represented as the mean ± standard error (SE) (n = 3). One-way ANOVA was used to determine statistical significance across treatment groups at P < 0.05 with the l.s.d. value (least significant difference). Different letters (a–c) denote the statistical difference across the treatment groups. The treatment groups are: AtCC (DBA Artemis control group parents, progeny treated with control), AtCW (DBA Artemis control group parents, progeny treated with water-deficit stress), AtWC (DBA Artemis water-deficit stress group parents, progeny treated with control), AtWW (DBA Artemis water-deficit stress group parents, progeny treated with water-deficit stress). SRO1, poly [ADP-ribose] polymerase SRO1 gene.

