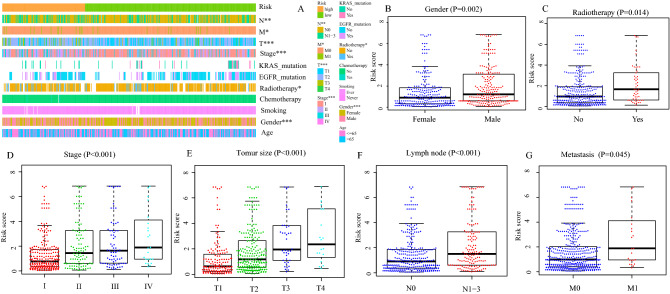
Figure 6.
Correlation between the IRGPs signature and clinical characteristics. (A) Heat map for the distribution of clinicopathological features between high- and low- risk group. (B) The difference of risk score between different gender, (C) between patients with and without radiotherapy, (D) among different TNM grades, (E) among different tumor size, (F) between with and without lymph node metastasis, (G) between with and without distance metastasis. *P < 0.05, **P < 0.01, ***P < 0.001.

