Figure 1.
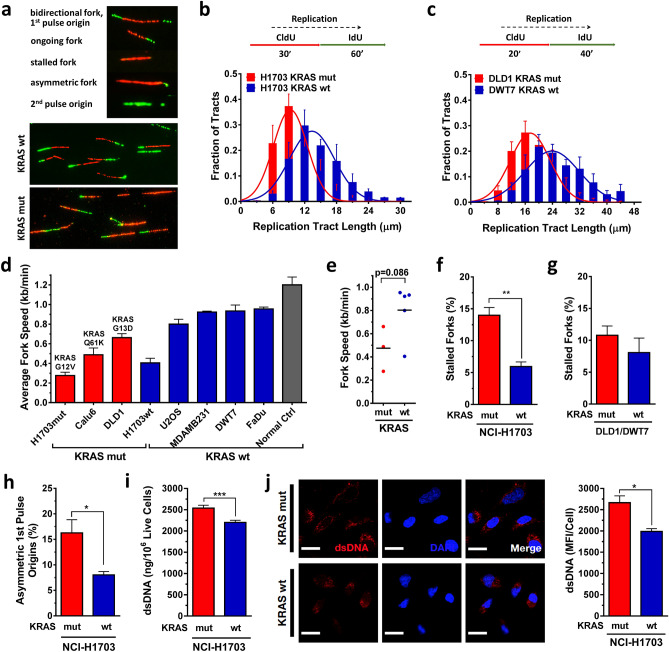
Baseline DNA replication stress and cytosolic DNA in KRAS mutant (mut) vs wild-type (wt) cancer cells. (a) Illustration of DNA fibers in exponentially growing cells that were pulse-labeled with thymidine analogues CldU and IdU and lysed after which DNA fibers were spread and immunodetected with specific antibodies against CldU and IdU. (b, c) Frequency distributions of DNA fiber length (i.e., CldU tract length) in isogenic cell pairs. (d, e) Velocity of fork progression in a panel of cancer cell lines (H1703, Calu-6 – lung cancer; DLD1/DWT7 – colon cancer; U2OS – osteosarcoma; MDA-MB231 – breast cancer; FaDu – head/neck cancer) and in a control (Ctrl) normal fibroblast line. (f, g) Percentage of fibers retaining only the first label (CldU) indicating fork stalling in isogenic cell pairs. (h) Percentage of bidirectional asymmetric forks that progressed through replication fork arrest. (i) Levels of double-stranded (ds) cytosolic DNA using PicoGreen dsDNA staining on cytosolic fractions from untreated cells. (j) Left, representative images of untreated cells stained with a dsDNA-specific antibody or DAPI. Right, semiquantification of fluorescent signal. All bars represent mean + /- SEM based on at least 3 independent repeats. Statistical comparisons by two-sided T-test indicating *p ≤ 0.05, **p ≤ 0.01, ***p ≤ 0.001.

