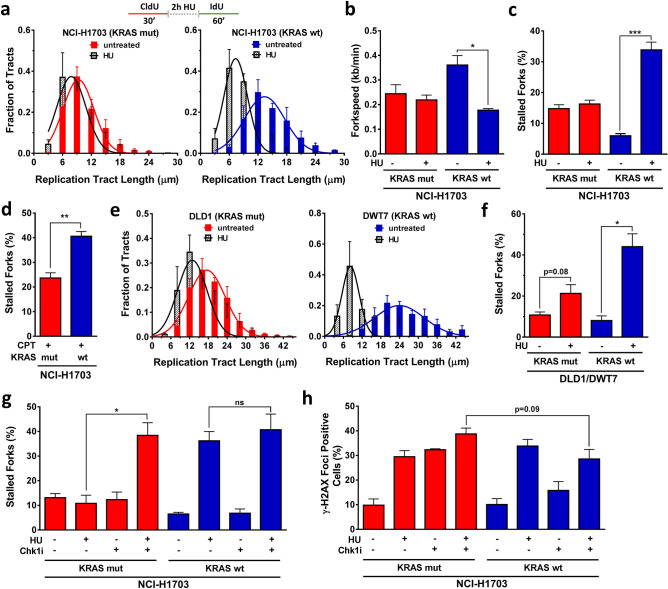
Figure 3.
Resistance of KRAS mutant (mut) but not wild-type (wt) cancer cells to hydroxyurea (HU). (a) Distribution of fiber length in the isogenic NCI-H1703 pair with and without HU treatment (2 mM) administered for 2 h in between pulse labels. (b) Velocity of fork progression with and without HU treatment. (c, d) Percentage of fibers indicating fork stalling with/without 2 h treatment with HU or the topoisomerase I inhibitor camptothecin (CPT). (e, f) Distribution of fiber length and percentage of fork stalling in isogenic DLD1/DWT7 cells, analogous to panels A and B. (g, h) Combined effects of treatment with HU and CHK1 inhibitor (Chk1i) LY2603618 on fork stalling or γ-H2AX foci formation. All bars represent mean + /- SEM based on at least 3 independent repeats. Statistical comparisons by two-sided T-test indicating *p ≤ 0.05, **p ≤ 0.01, ***p ≤ 0.001; ns, not significant.

